The fourth edition of European Democracy Consulting’s annual Geographical Representation in EU Leadership Observatory (GRELO2024) reveals a worsening of European citizens’ representation in leadership positions, and calls on Member States and EU institutions — in particular the European Council and Commission — to take strong action to ensure a fairer representation for all European citizens.
In January 2021, European Democracy Consulting’s seminal edition of the Geographical Representation in EU Leadership Observatory provided the first reliable data to examine, in a systematic and detailed manner, the level of geographical representation of EU citizens in European institutions. GRELO2022 and 2023 editions confirmed three major conclusions: the overall combined dominance of Western and Southern Europe, together receiving over 80% of all appointments since the EU’s 2004 enlargement, the unique situation of Northern Europe, far outpacing all other regions when adjusting for population sizes, and the clear and continued under-representation of Central and Eastern European citizens.
Today, our Geographical Representation in EU Leadership Observatory 2024 provides a useful update of previous observations, and allows us to measure the progress — or lack thereof — accomplished in 2023 and over the 2021-2023 triennium. The main conclusion of this 2024 edition is a dramatic worsening of the representation of citizens from Central and Eastern Europe. As always, GRELO2024 concludes with actionable recommendations aimed at improving geographical representation in our European institutions. Once again, our research rests on a fully public dataset, which was revised and upgraded so as to better serve the scientific community and public authorities.
We wish to warmly thank all the EU institutions, bodies and agencies that have cooperated with this survey by providing information on their leadership in a timely manner. Their support and commitment to transparency is much appreciated. Of course, we welcome corrections for any identified error in our dataset.
Find here our press release and follow us on social media at @EDC_eudemocracy.
© 2024 European Democracy Consulting
Fourth edition of the Geographical Representation in EU Leadership Observatory, published in April 2024.
European Democracy Consulting publications are independent of specific national or political interests. They are based on objective facts and data and reflect our analysis. The Geographical Representation in EU Leadership Observatory and its 2024 edition constitute pro bono work and were not commissioned by any third-party.

The Geographical Representation in EU Leadership Observatory 2024 and its related dataset by European Democracy Consulting are licensed under a Creative Commons Attribution-NonCommercial-ShareAlike 4.0 International License.
You are free to copy, distribute and transmit the publication as well as to remix and adapt it, provided it is only for non-commercial purposes, that you appropriately attribute the publication (European Democracy Consulting, https://eudemocracy.eu/grelo2024), and that you distribute it under an identical license.
For more information on this licence visit the Creative Commons website: http://creativecommons.org/licenses/by-nc-sa/4.0/
European Democracy Consulting
Telephone: +33(0)7.81.03.32.87
Email: contact@eudemocracy.eu
Website: https://eudemocracy.eu/
Data and design: European Democracy Consulting
Abstract
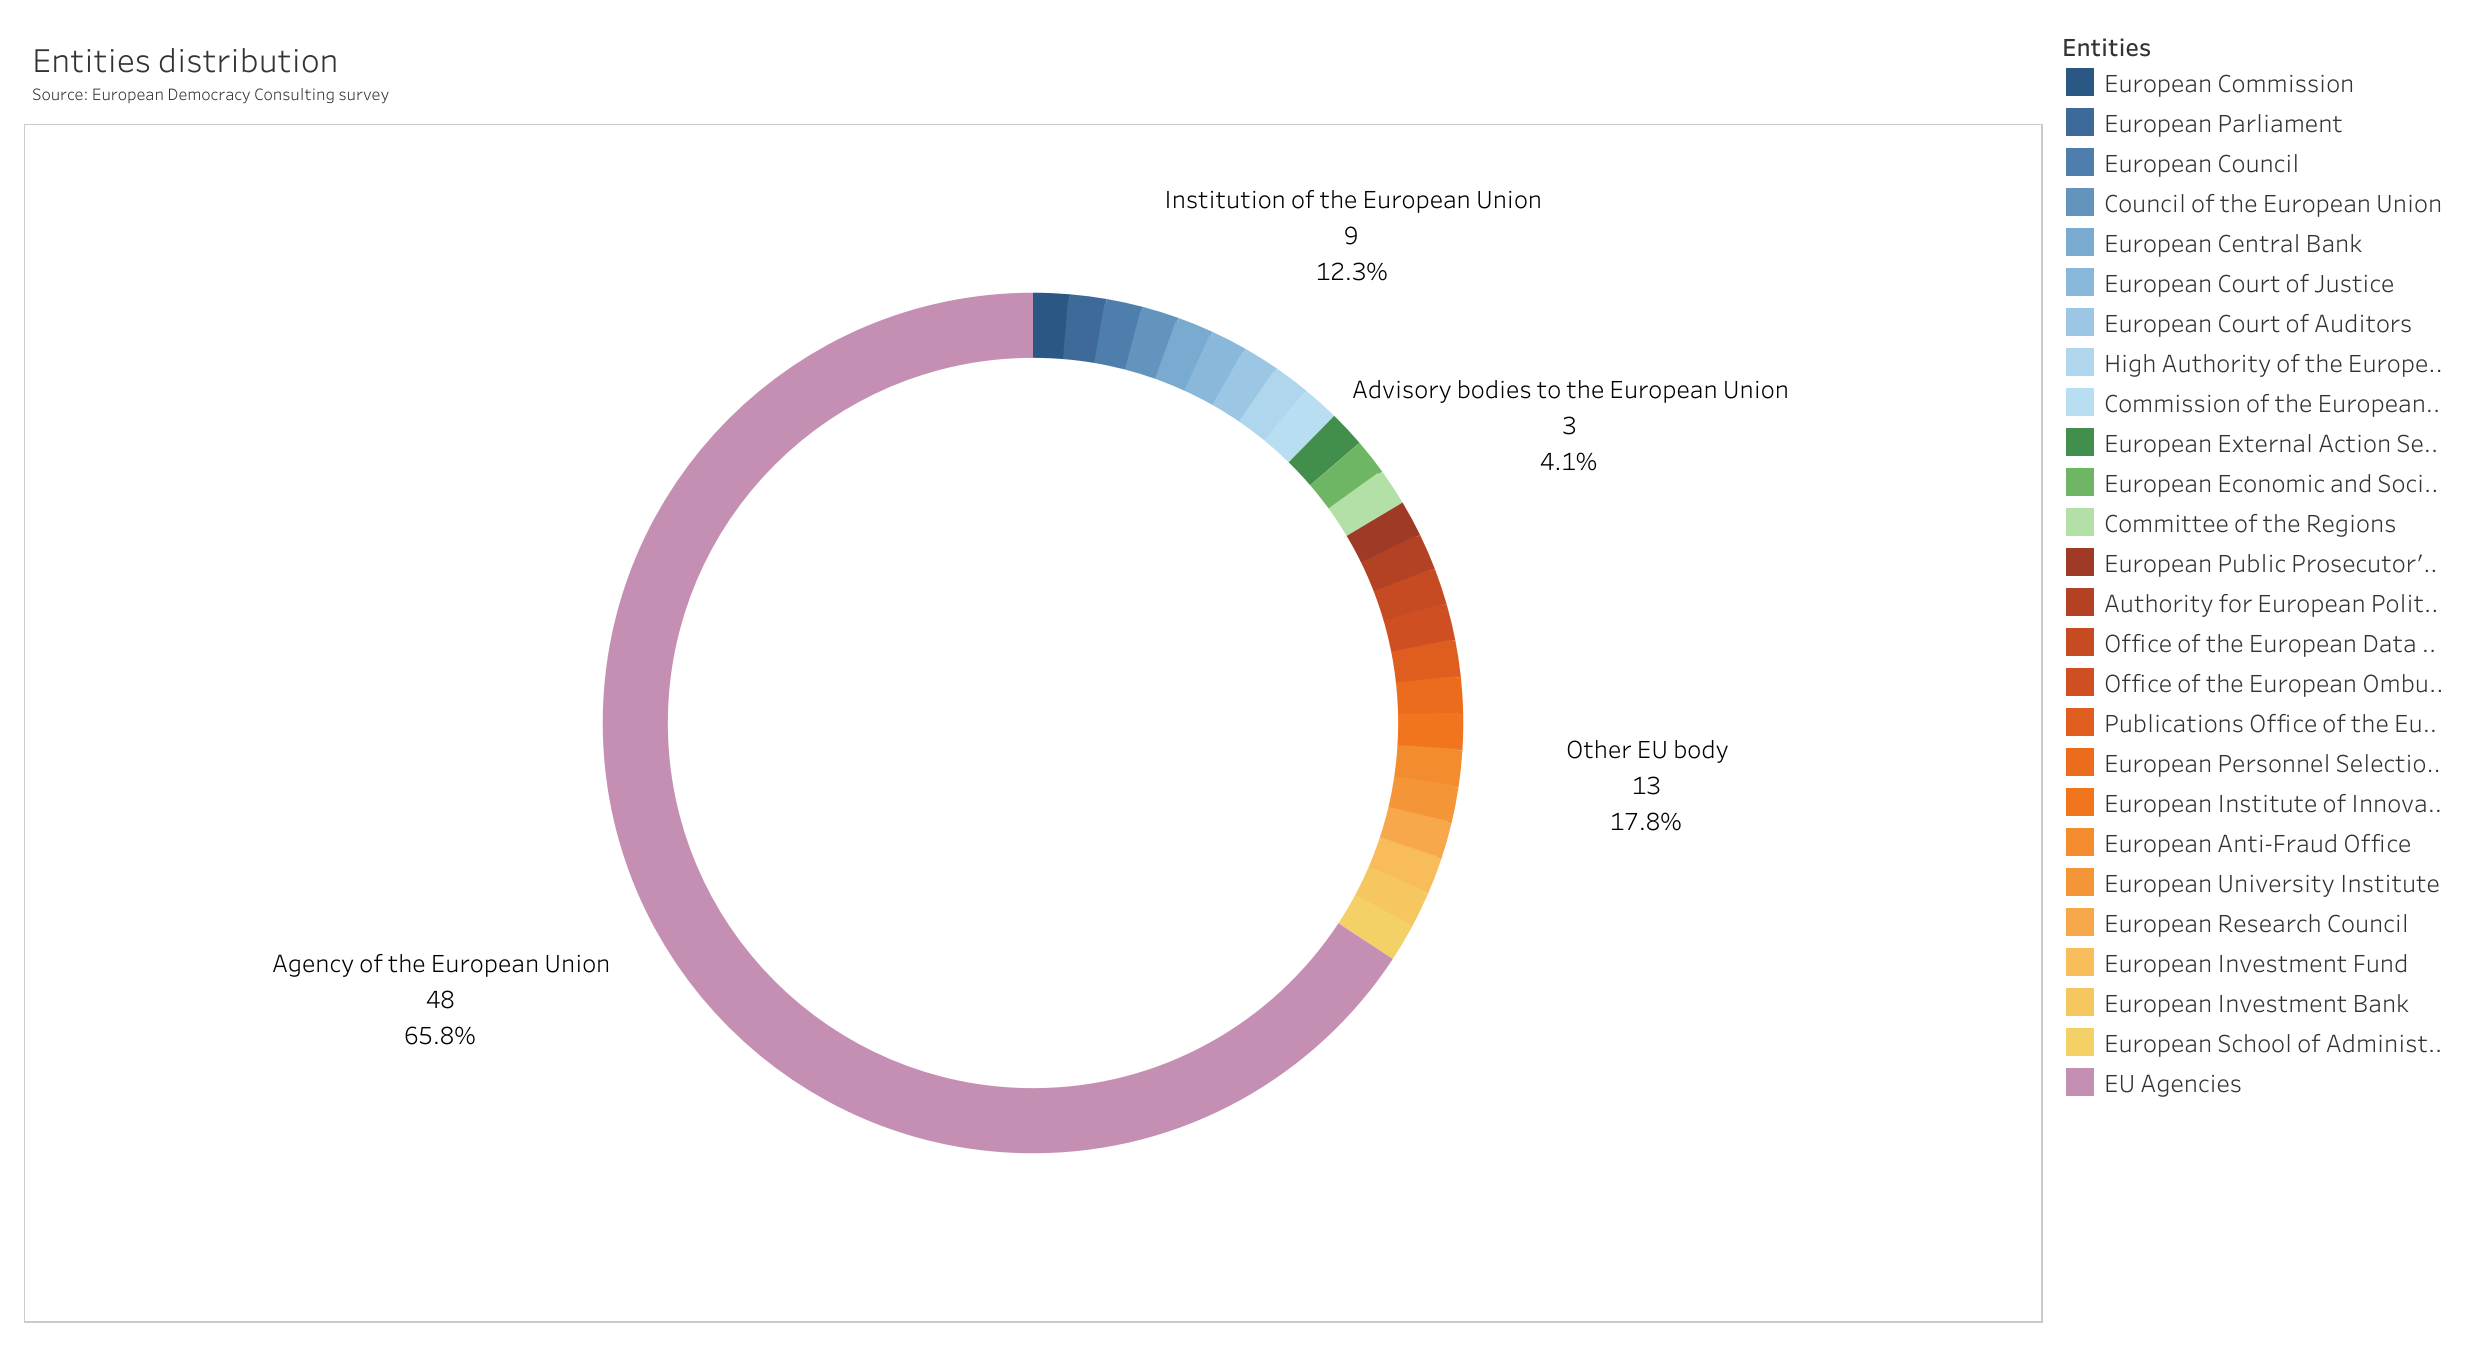
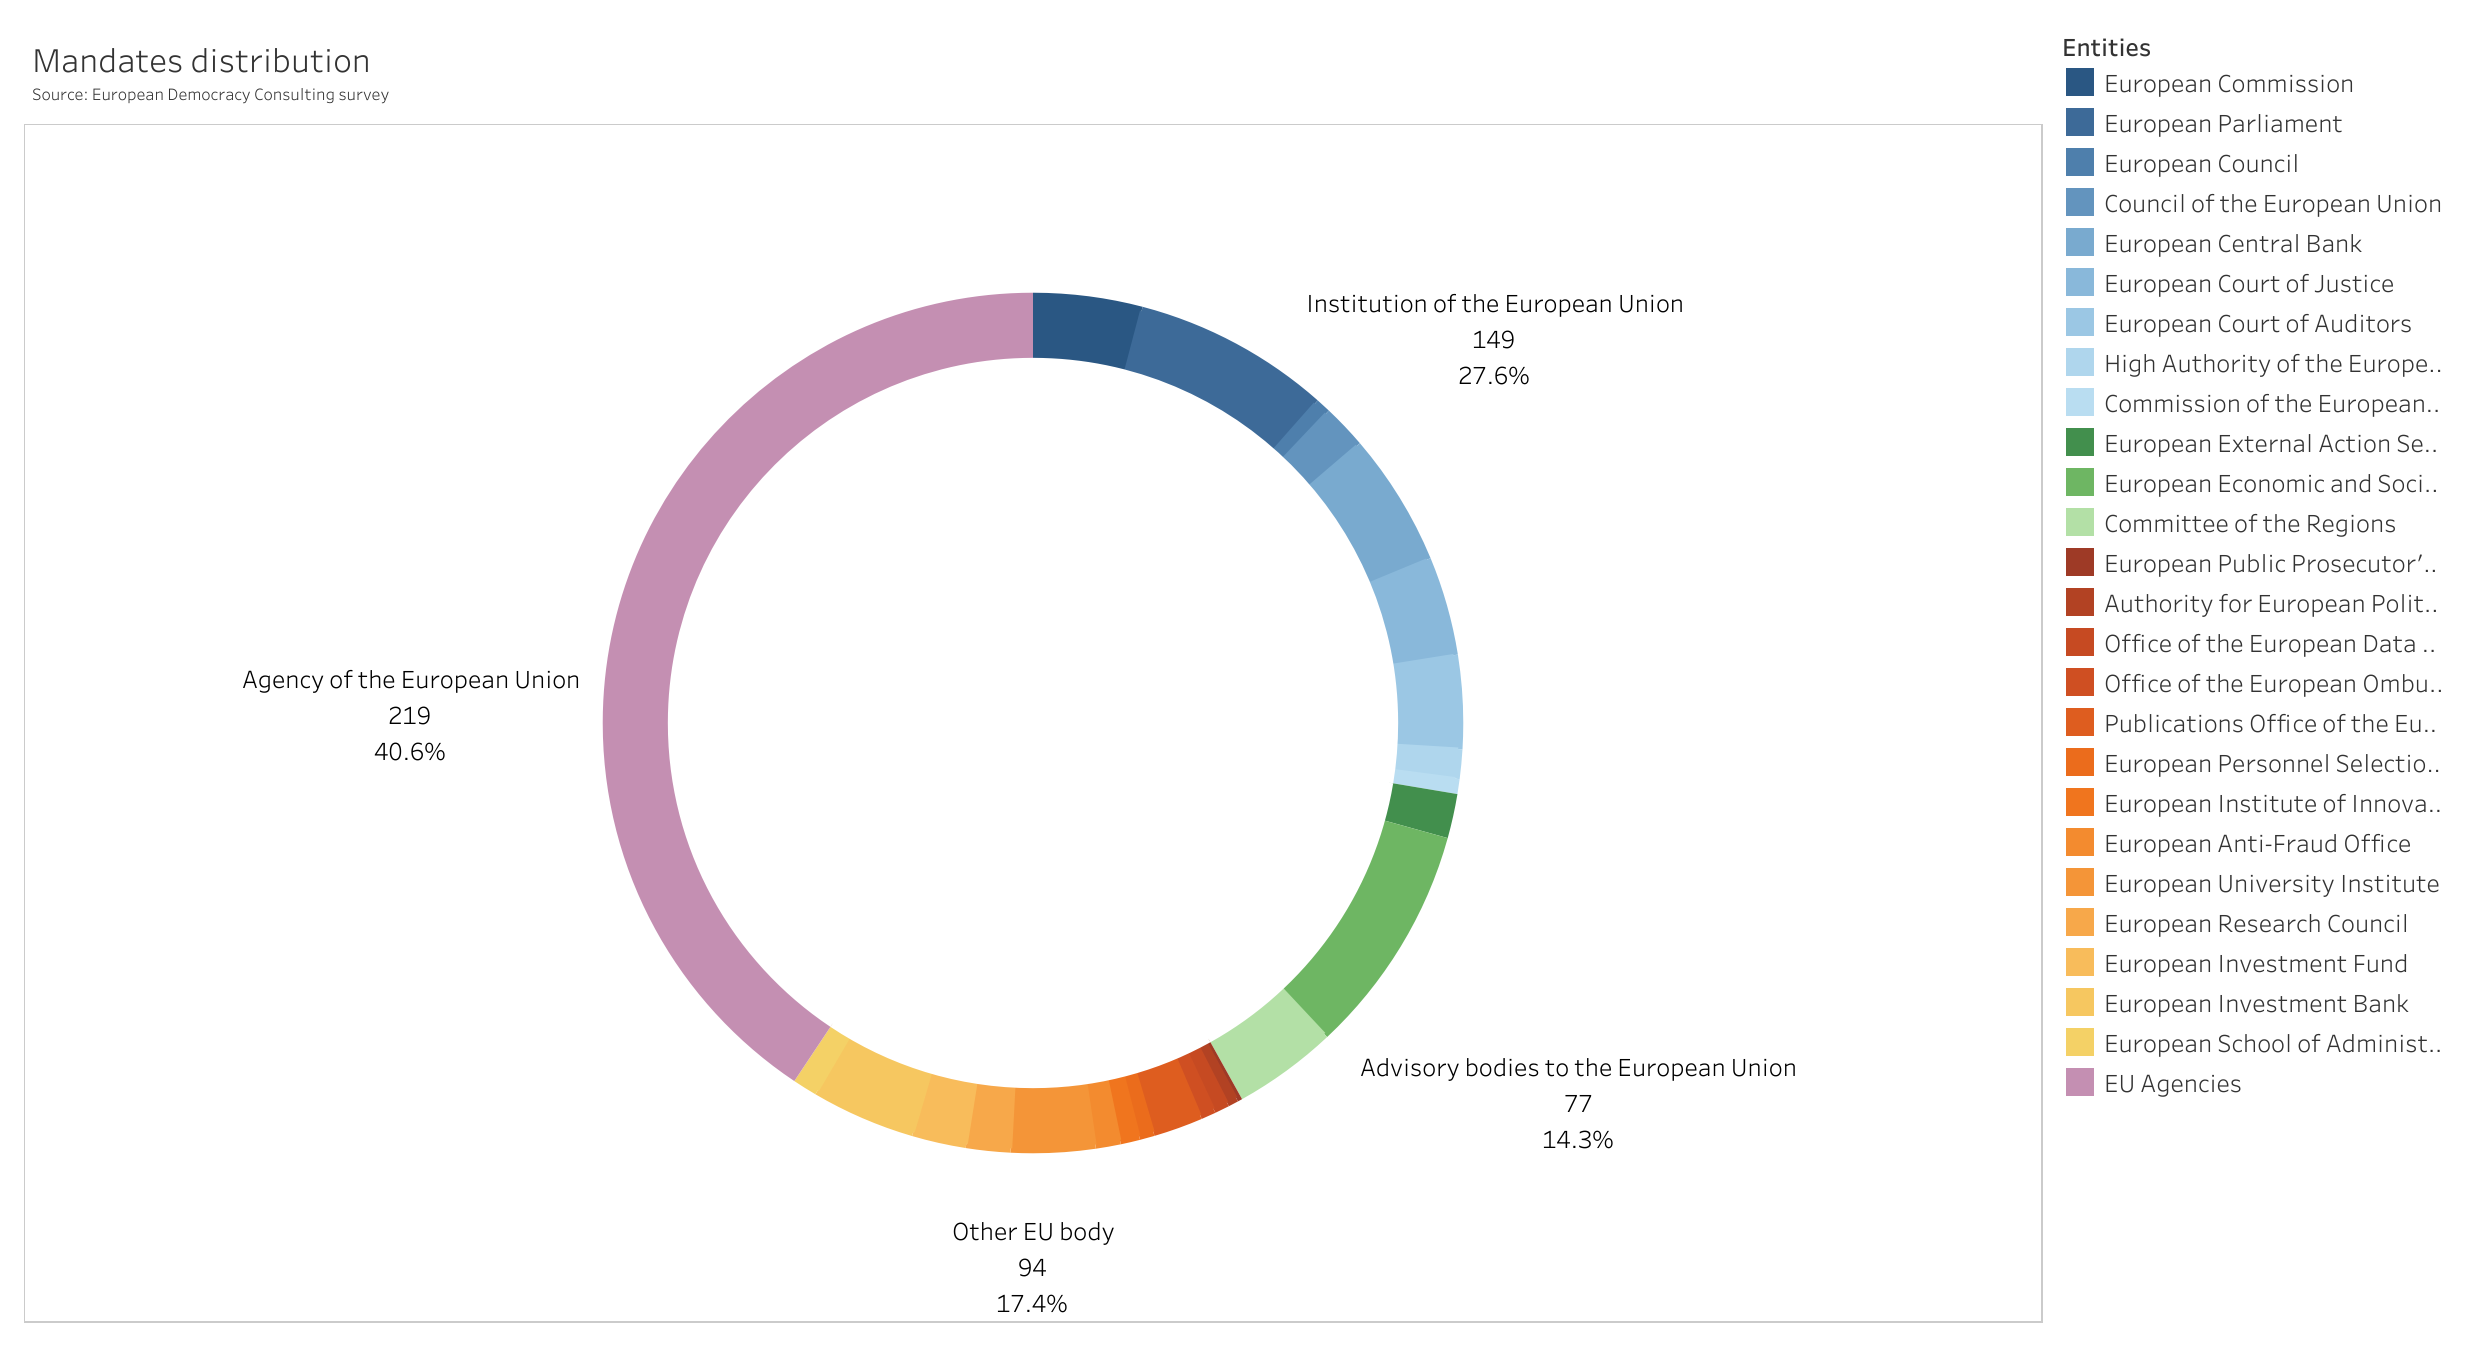
The Geographical Representation in EU Leadership Observatory 2024 (GRELO2024) updates our analysis of geographical representation among the European Union’s leadership positions. The regions surveyed are Western, Southern, Northern, Central, and Eastern Europe, and the positions are the executive leaders of the EU’s institutions, advisory bodies, agencies and other bodies. The 2024 Observatory covers 73 EU entities, 90 positions, and 539 office-holders from 1952 to the end of 2023.
Given the EU’s dual emphasis on Member State equality and population-based proportionality, this Observatory questions regions’ equality from three different angles: as equal between one another, pro rata of their number of Member States, and pro rata of their population sizes. Given Member States’ differentiated dates of accession, the Observatory also allows a focus on more recent years (especially after the 2004 EU enlargement, which saw ten countries from Central and Eastern Europe accede to the Union), as well as on Member States’ first years of membership.
In particular, GRELO2024 reviews appointments made in 2023 and in the 2021-2023 triennium, and assesses recent trends in geographical representation. The Observatory concludes with a series of actionable recommendations to improve geographical representation in the EU’s leadership.
KEY WORDS: geographical representation; regional representation; leadership; East-West divide; European Union; European institutions.
Key figures and survey conclusions
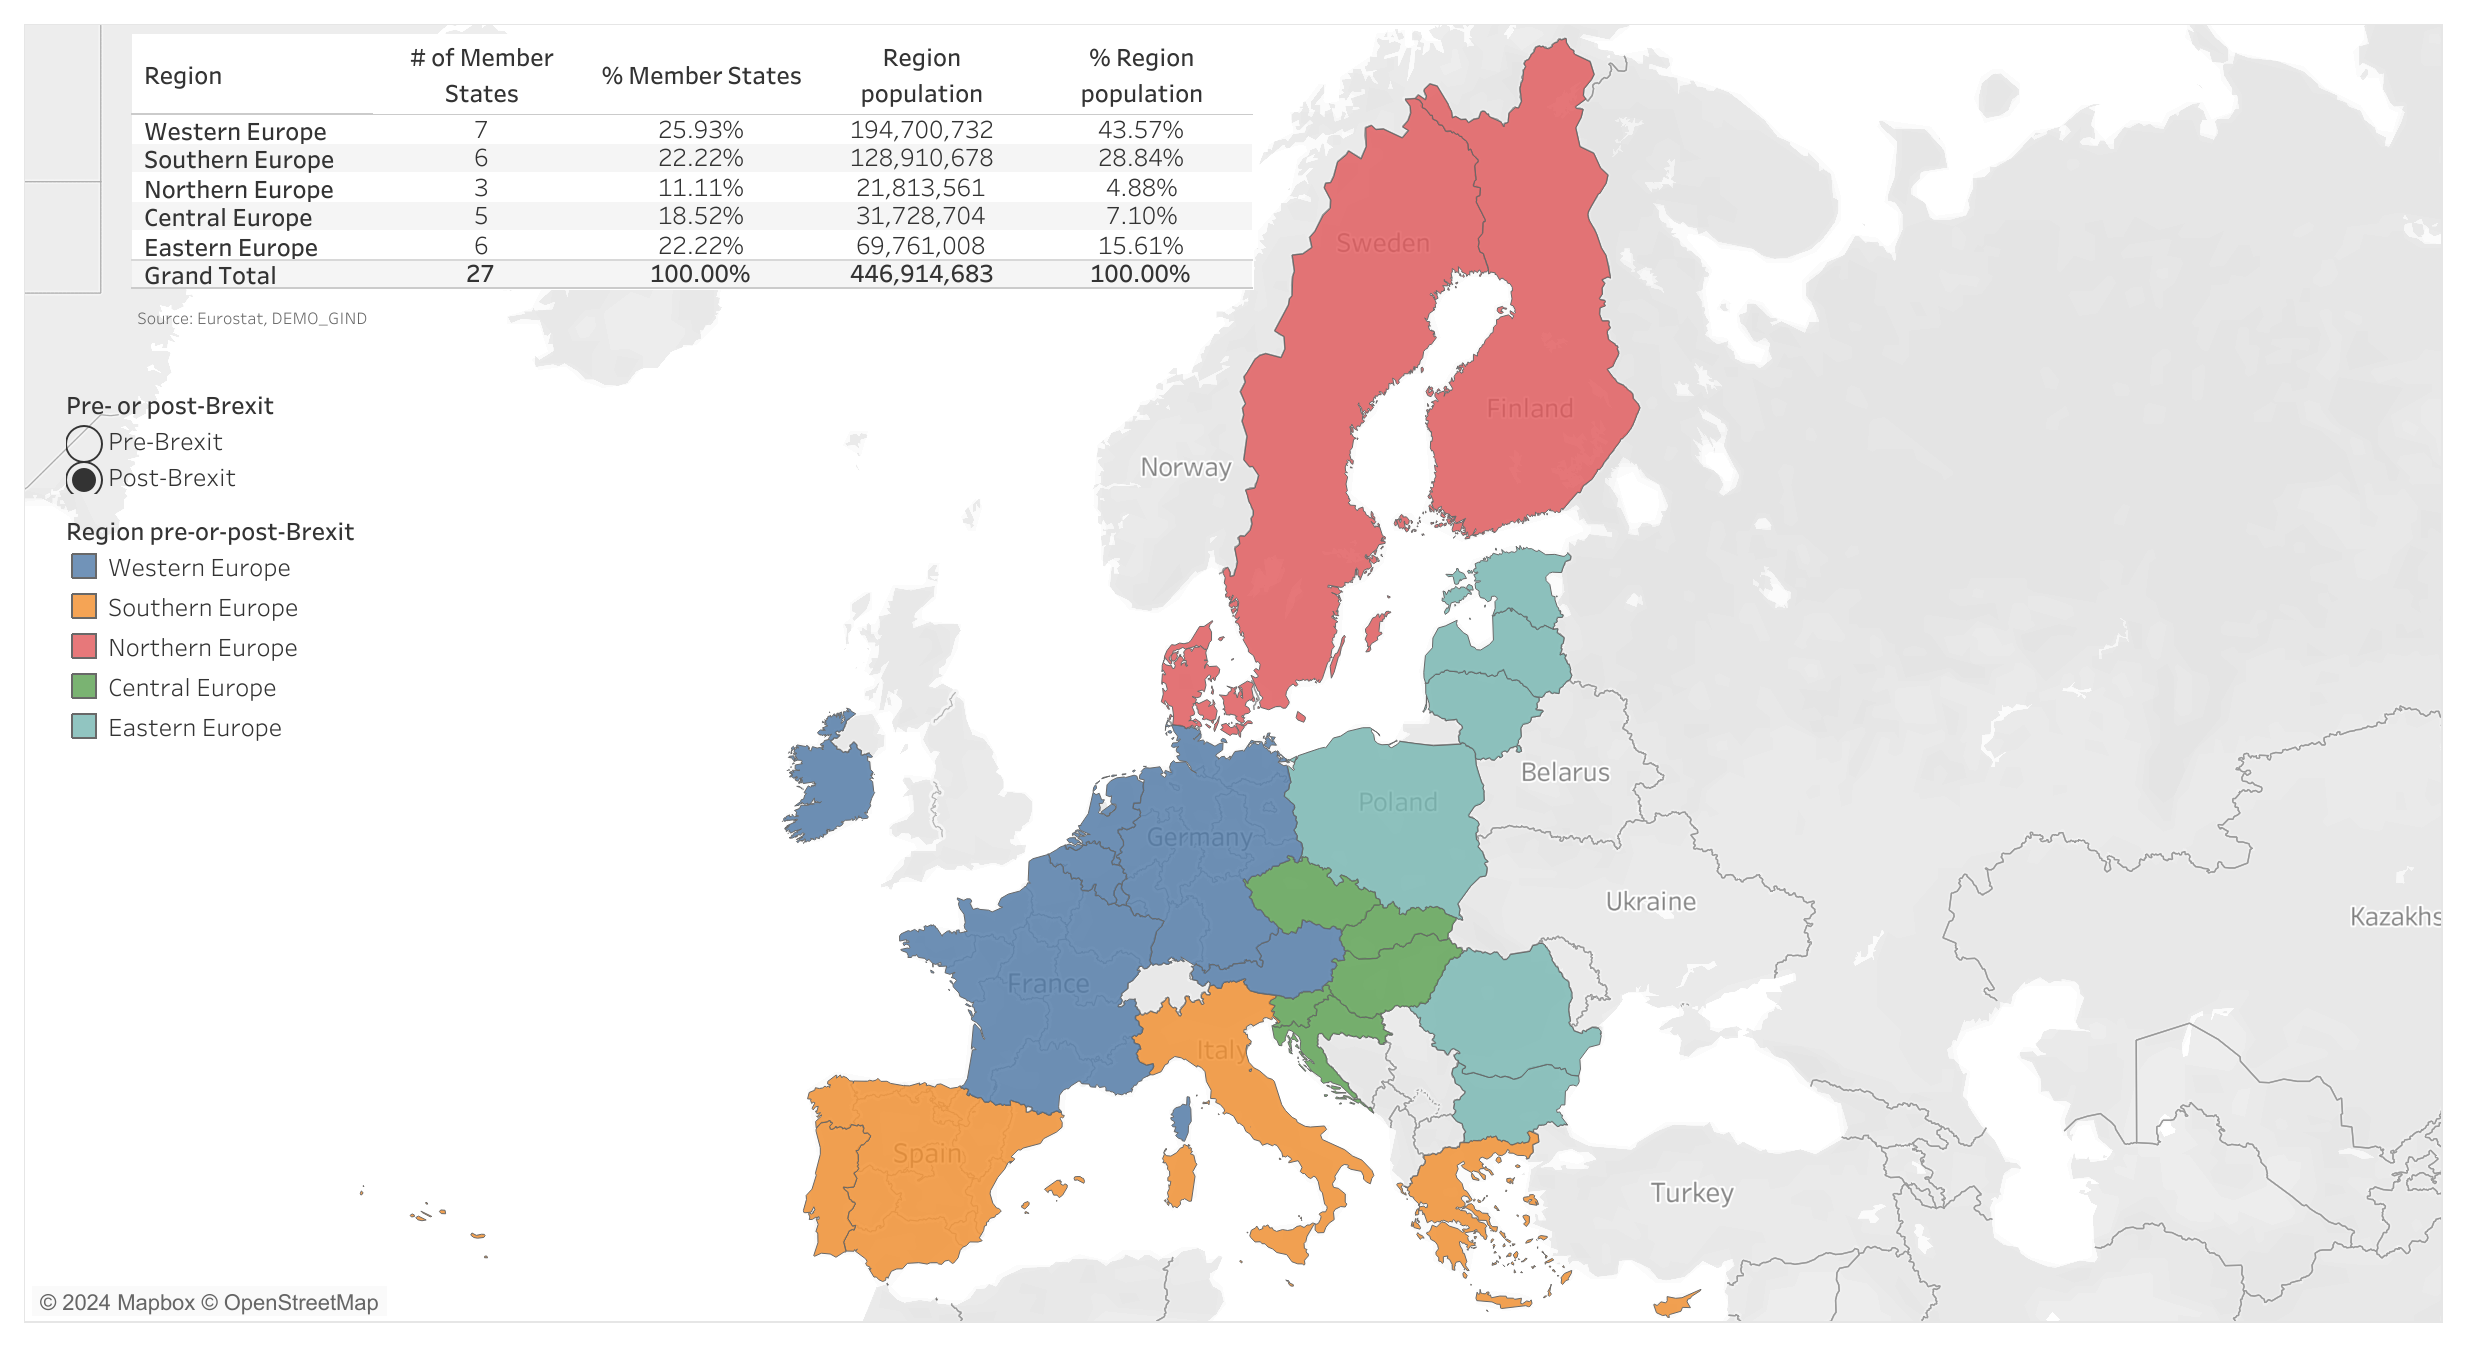
Note: whether based on regional equality, on regions’ number of Member States, or on their population, for each of the five regions to achieve equal representation means reaching a 20% “equality mark” — or one fifth per region.
- Increasing its dominance, Western Europe alone received 73% of new appointments in 2023, and 60% over the 2021-2023 triennium (up from 35% in 2018-2020).
- Meanwhile, not a single citizen from Central and from Eastern Europe was appointed to a leadership position in 2023. These regions accounted for under 2 and 4%, respectively, of appointments for 2021-2023, their lowest levels in years.
- Pro rata of regions’ number of Member States, Western Europe still received over 51% of appointments in 2021-2023, a 14-point increase compared to the last triennium. Even accounting for populations sizes, citizens from Western Europe earned more than 1.5 their fair share of office-holders in 2023, compared to just over a quarter of their fair share for Central and Eastern Europe.
- Overall, figures for 2023 and for the 2021-2023 triennium show a dramatic worsening of representation for citizens from Central and Eastern Europe.
- Finally, while the European Commission and Council were only responsible for 33% of appointments between 2020 and 2022, Member State governments, their representatives and appointees were involved in 67% of all appointments. In the meantime, EU representatives directly elected by citizens were responsible for only 3% of appointments.
Recommendations
- Acknowledge the lack of proper geographical representation in the EU’s leadership, its likely negative impact on citizens’ inclusion, as well as the central role of the Council, Commission, and Member States’ representatives and appointees;
- Establish dimensions of analysis in order to assess the situation and, provide baseline measures to understand the status quo (for this, GRELO already provides a solid basis);
- Establish goals and targets, including a clear long-term goal and one or more time-bound intermediary goals;
- Define clear actions, including ensuring data collection, adopting affirmative action policies, diversifying communication channels to reach a wider audience, improving the selection process and criteria to make it more inclusive, and facilitating the integration and retention of new recruits;
- Track progress publicly through a yearly review of geographical representation (as GRELO currently does); and
- Above all, act on the conclusions of this report and do not leave the results of this analysis to Eurosceptic movements.
Table of Contents
Context
Institutions, bodies and agencies and positions observed
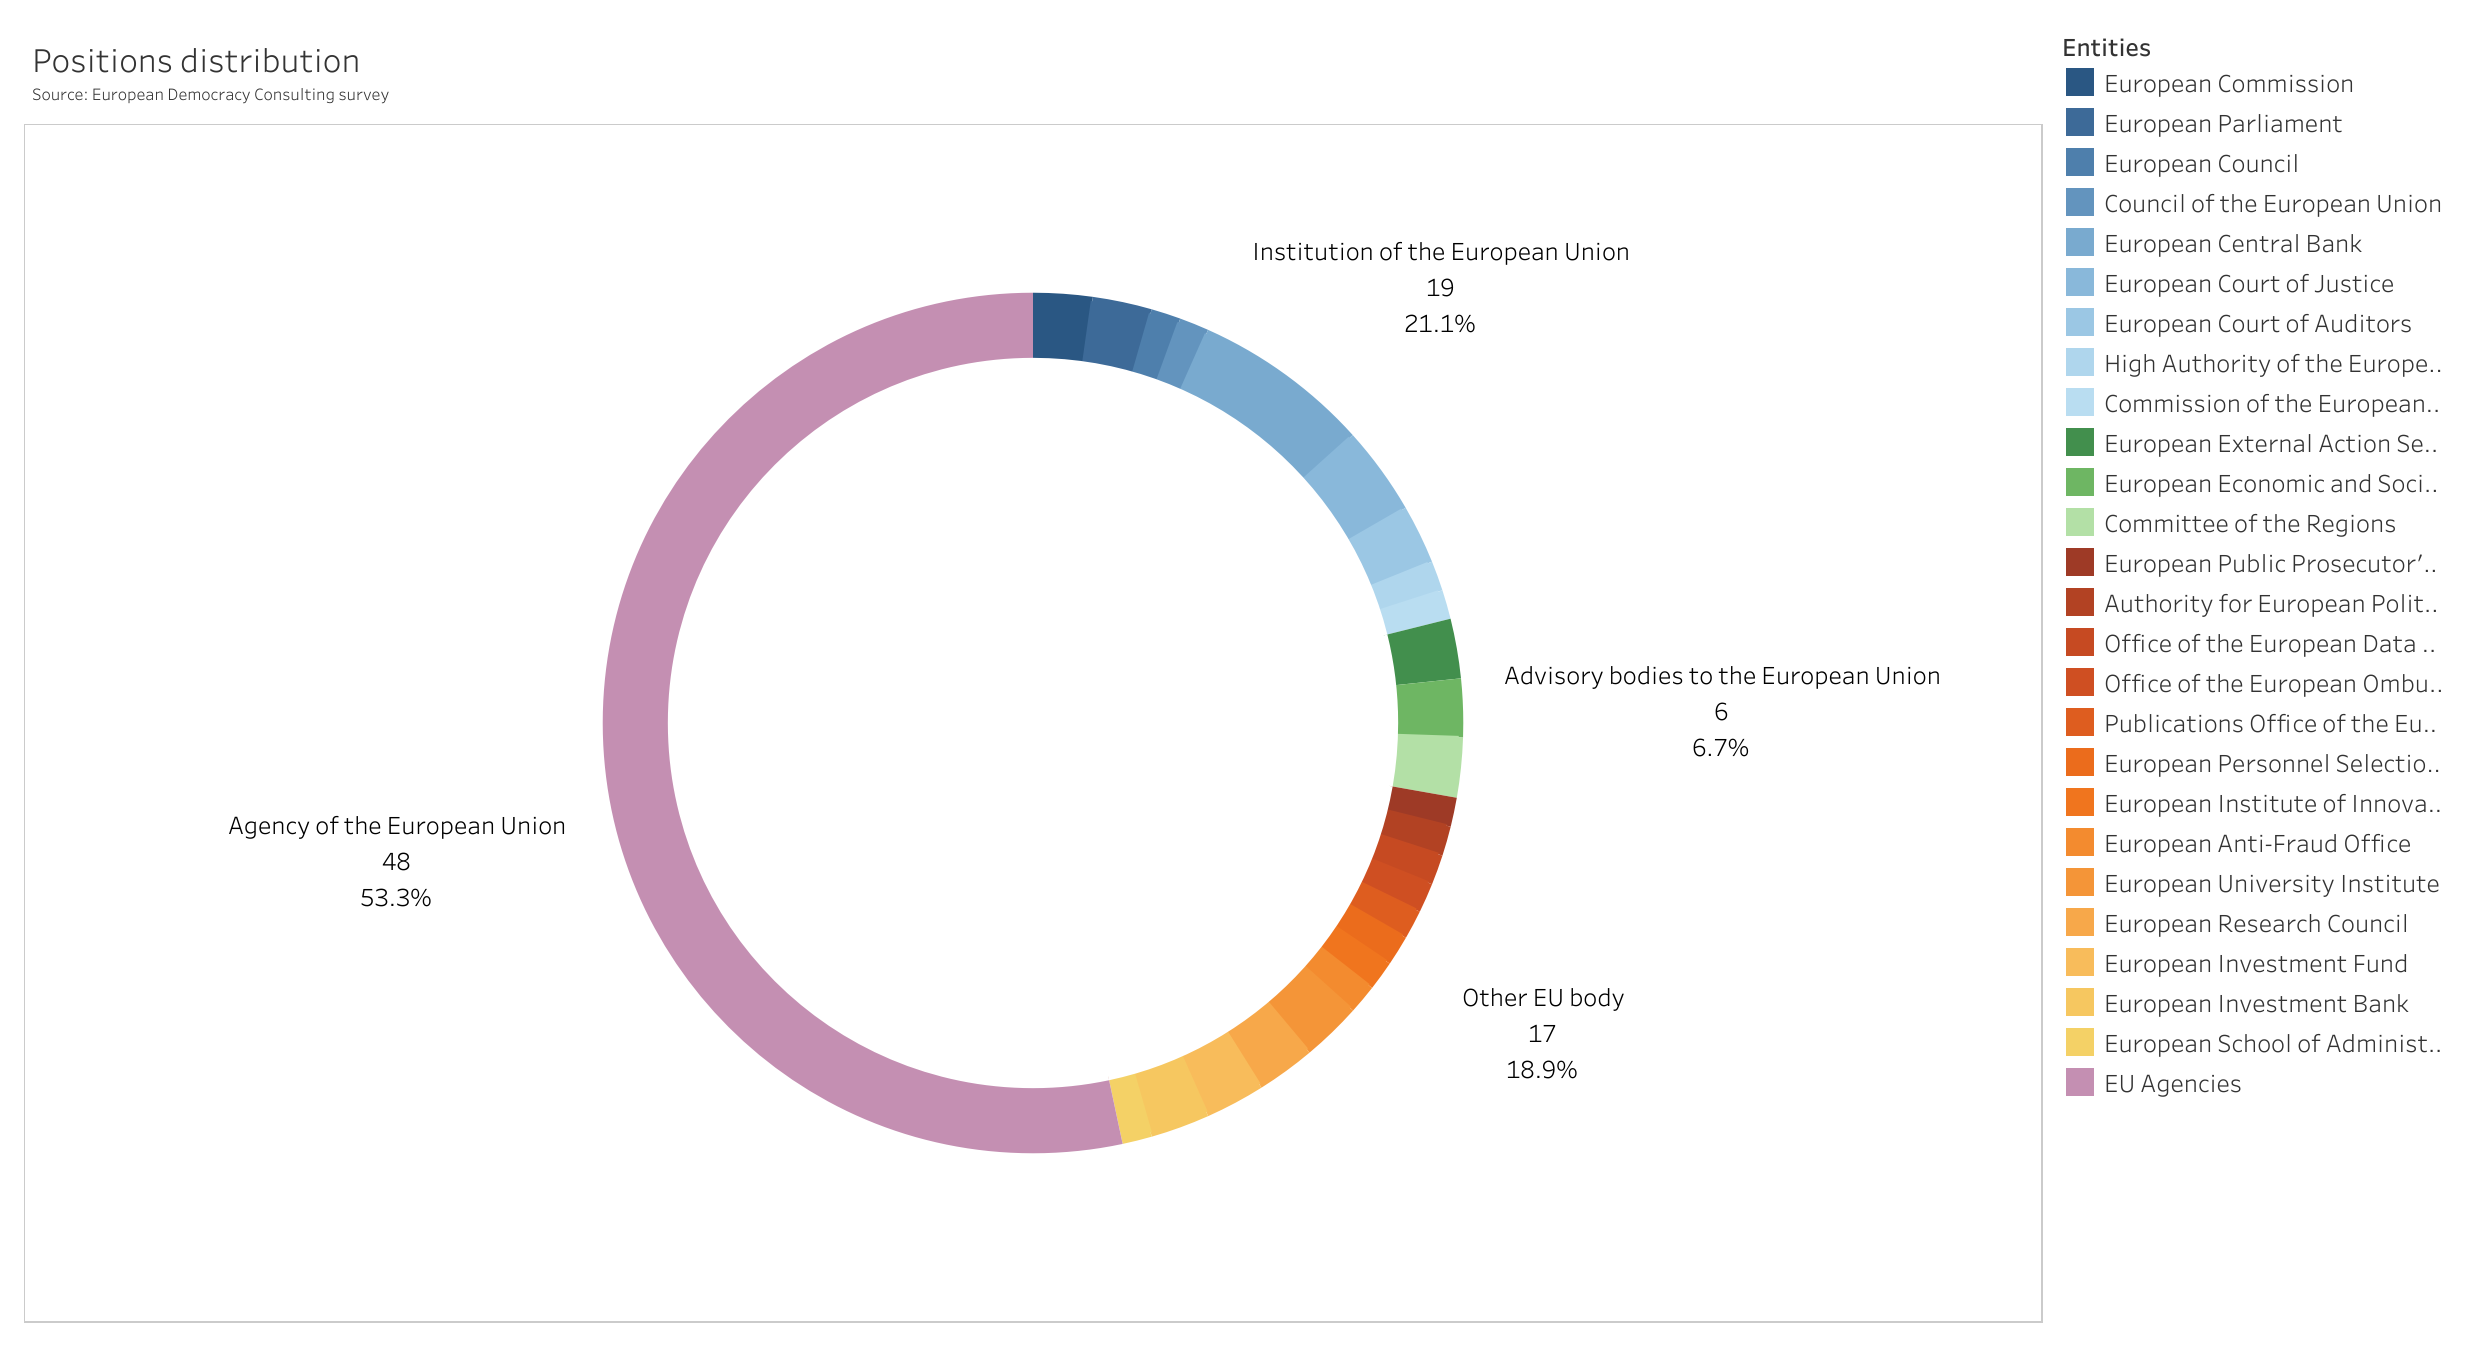
GRELO2024 retains our established grouping of EU entities as Institutions of the European Union, Advisory bodies to the European Union, Agencies of the European Union, and Other EU bodies.1
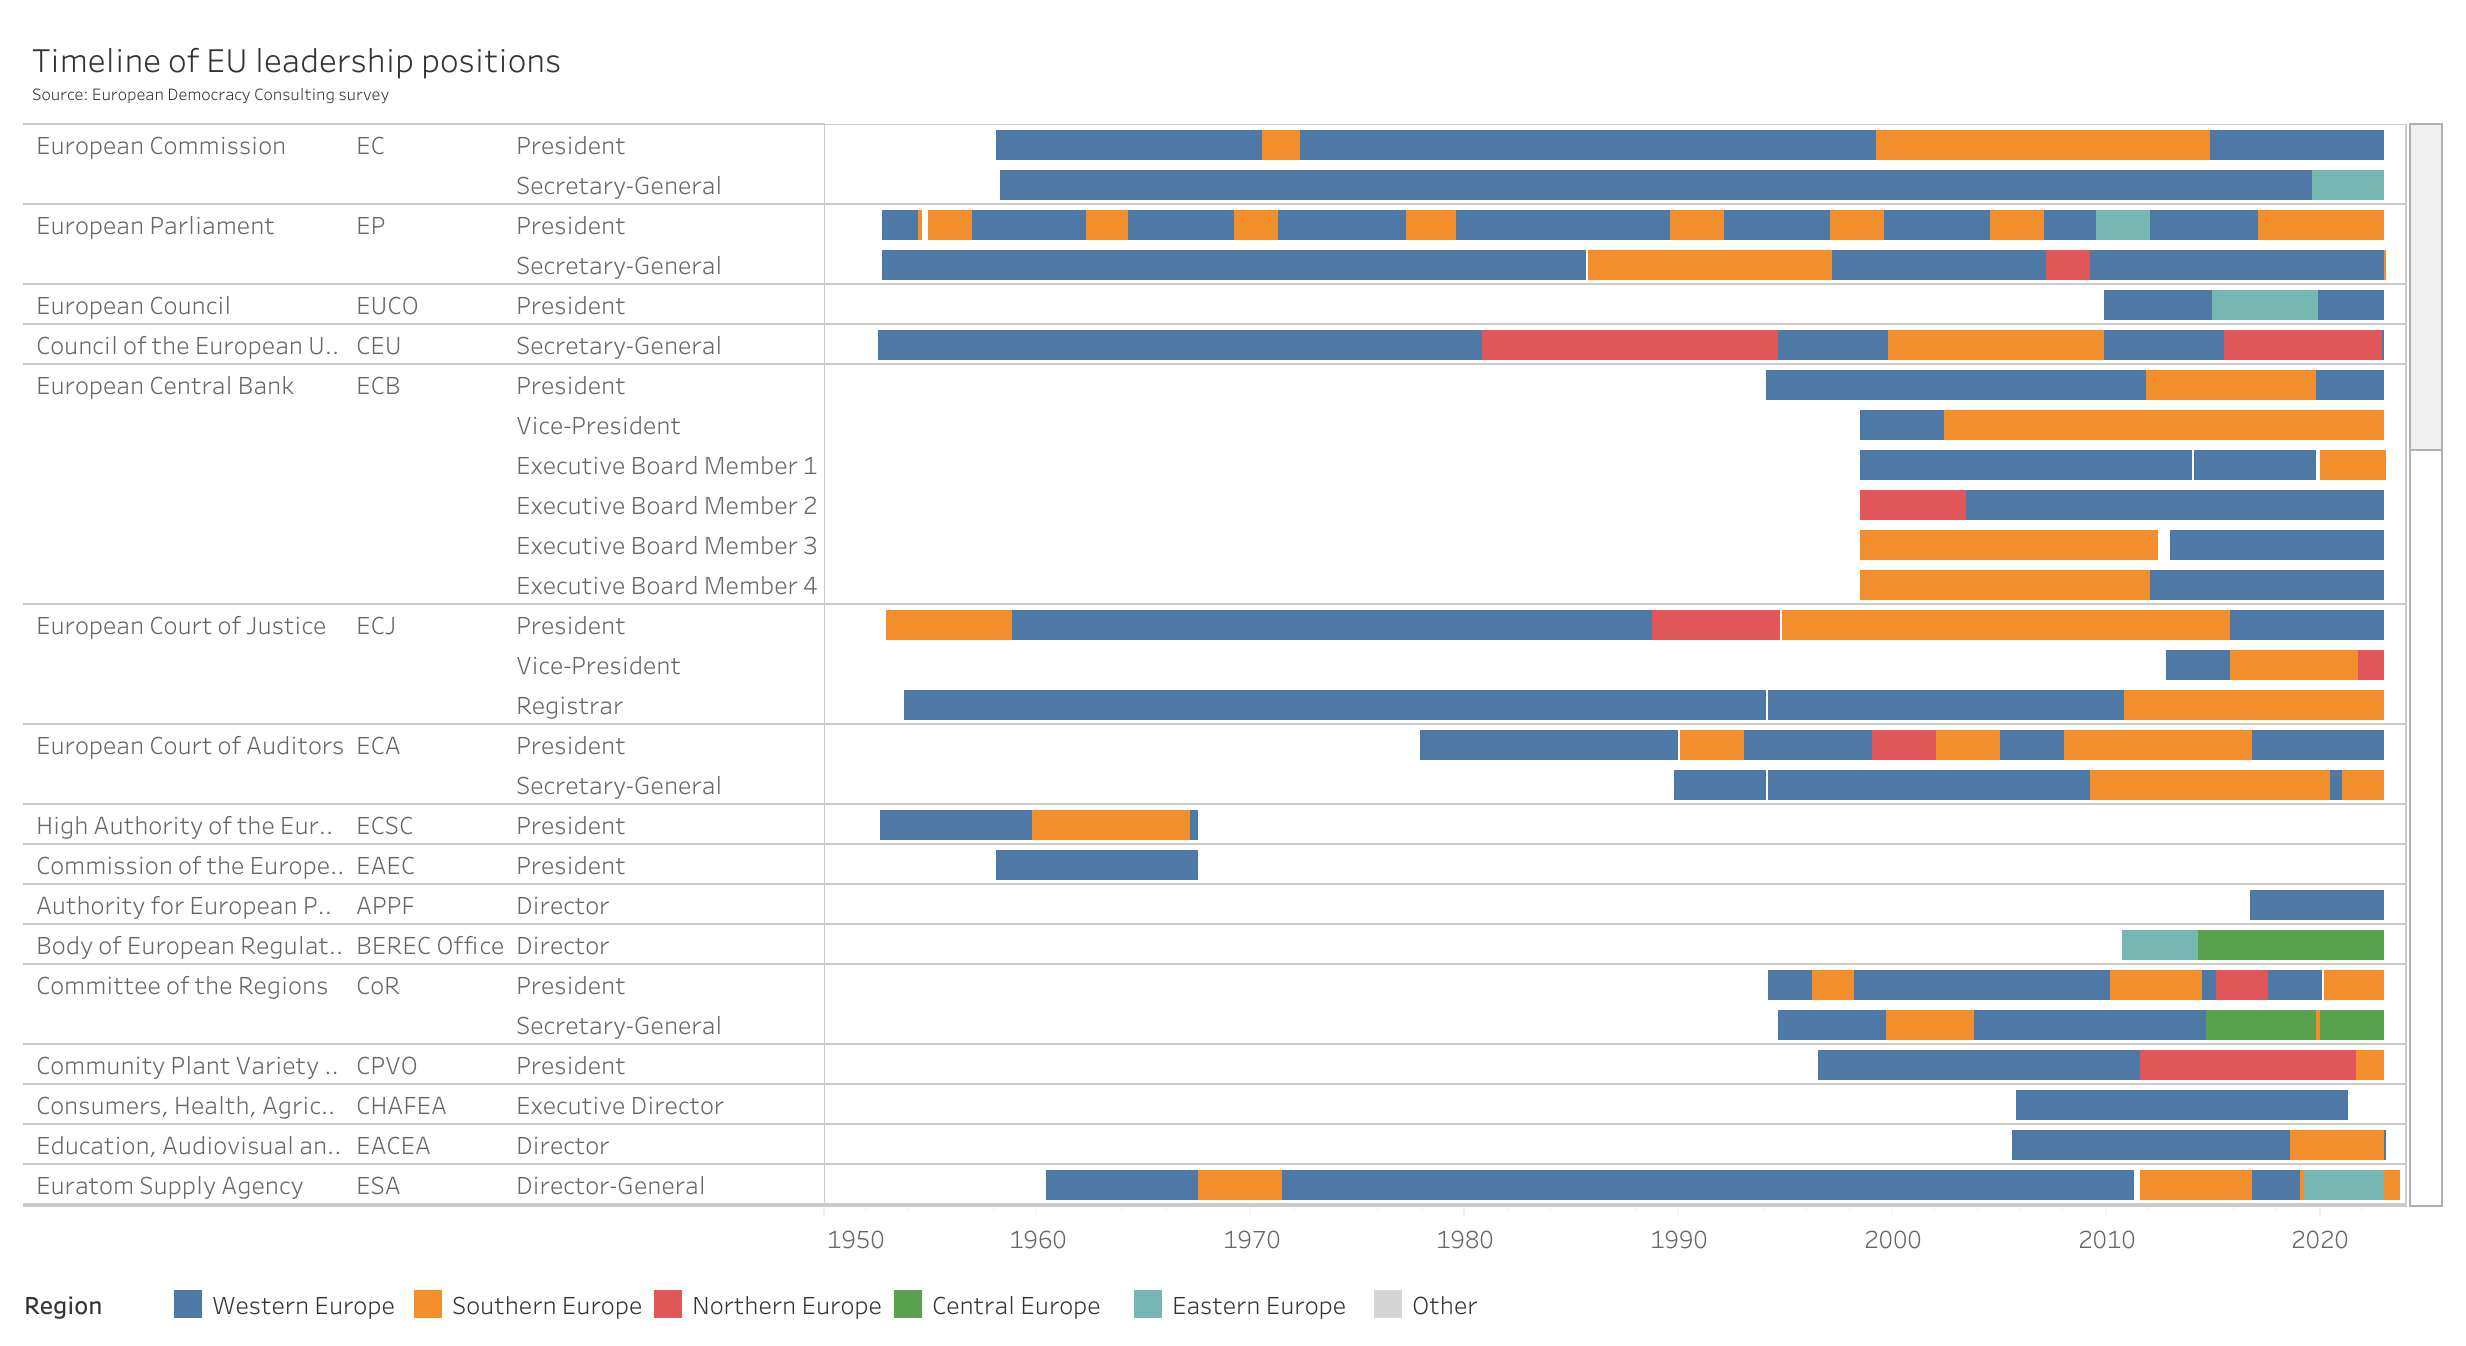
- Institutions of the European Union: the seven entities listed in Article 13.1 of the Treaty on European Union and two legacy institutions — the Commission of the European Atomic Energy Community and the High Authority of the European Coal and Steel Community. For these entities, we focus on the President, who is often a public figure, in particular for the so-called “top jobs”.2 We also cover the positions of Secretary-General for the European Commission, the European Parliament, and the Council of the European Union, of members of the Executive Board for the European Central Bank, and of Vice President, Registrar, and Secretary-General for the Court of Justice and Court of Auditors.
- Advisory bodies to the European Union: three entities created by the European treaties, but lying outside of the main institutional framework (Articles 13.4 TEU and 38 TEU). They have no legislative or decision-making powers, and their main role is to advise EU institutions. One of them, the Political and Security Committee, is headed by the High Representative of the European External Action Service (HR/VP); given its composite structure, the EEAS and its HR/VP are placed in this category. For advisory bodies, we cover the positions of President (and HR/VP, as relevant) and Secretary-General.
- Agencies of the European Union: EU agencies form a diverse group of decentralised bodies established for specific tasks and endowed with their own legal personality. Their fields of work are extremely diverse, ranging from law enforcement, to health, transportation, etc. EURATOM agencies are included, but not Joint Undertakings (public-private partnerships set up under the Horizon 2020 programme). For agencies, we focus on the top executive position, usually called Director or Executive Director.3
- Other EU bodies: finally, the EU has set up a number of other independent bodies for specific purposes, which are best placed together in a category of their own, despite their unique characteristics. These include, for instance, the Authority for European Political Parties and European Political Foundations (APPF), the Office of the European Data Protection Supervisor (EDPS), and the European School of Administration (EUSA). For these bodies, we focus on the single top executive position, with the exceptions of the European Investment Bank, European Investment Fund, and European University Institute. The specific names of these positions vary widely depending on the entity, ranging from the classic Director, to names reflecting the Office in question, such as European Ombudsman, European Data Protection Supervisor, or European Public Prosecutor.
Institutional changes in 2023
The GRELO2024 update does not introduce changes in terms of entities or positions surveyed. The EU’s most recently created entity — the European Union Agency for the Space Programme, which took over from the European GNSS Agency — was set up in May 2021. Likewise, the executive agencies of the Commission have not changed since their major reshuffling of 2021.4
Finally, on 13 December 2023, the European Parliament and Council agreed to the creation of the Anti-Money Laundering Agency (AMLA)5 and, in february 2024, the two institutions decided on Frankfurt as the seat of this new agency.6
Considerations on representation and legitimacy
As stated in previous GRELO editions, the first and foremost criteria for the appointment of leadership positions must be and remain individual competence, whether it is called merit, expertise, experience, etc. Of course, ideology may be another important element in the case of political appointments.
However, while differences in levels of representation may be understandable between demographic sub-groups, the clear and continued lack of representation of large segments of the population (in the case of the EU, of national or regional sub-groups) is detrimental to citizens’ feeling of proper representation and, therefore, to their trust in their common public institutions. This impact may eventually affect voter behaviour and, parting, the “europeanness” of national leaders, which would in turn impact EU governance and cohesion.
Noting the continued rise of Eurosceptic feelings and illiberal policies in Central Europe, and until recently in Poland, as well as the general rise of the far-right across the continent, it is important to review the sociology of European leaders, with a particular focus on their national citizenship, so as to address imbalances that may further alienate the citizens of parts of our Union.
Observatory data and analysis
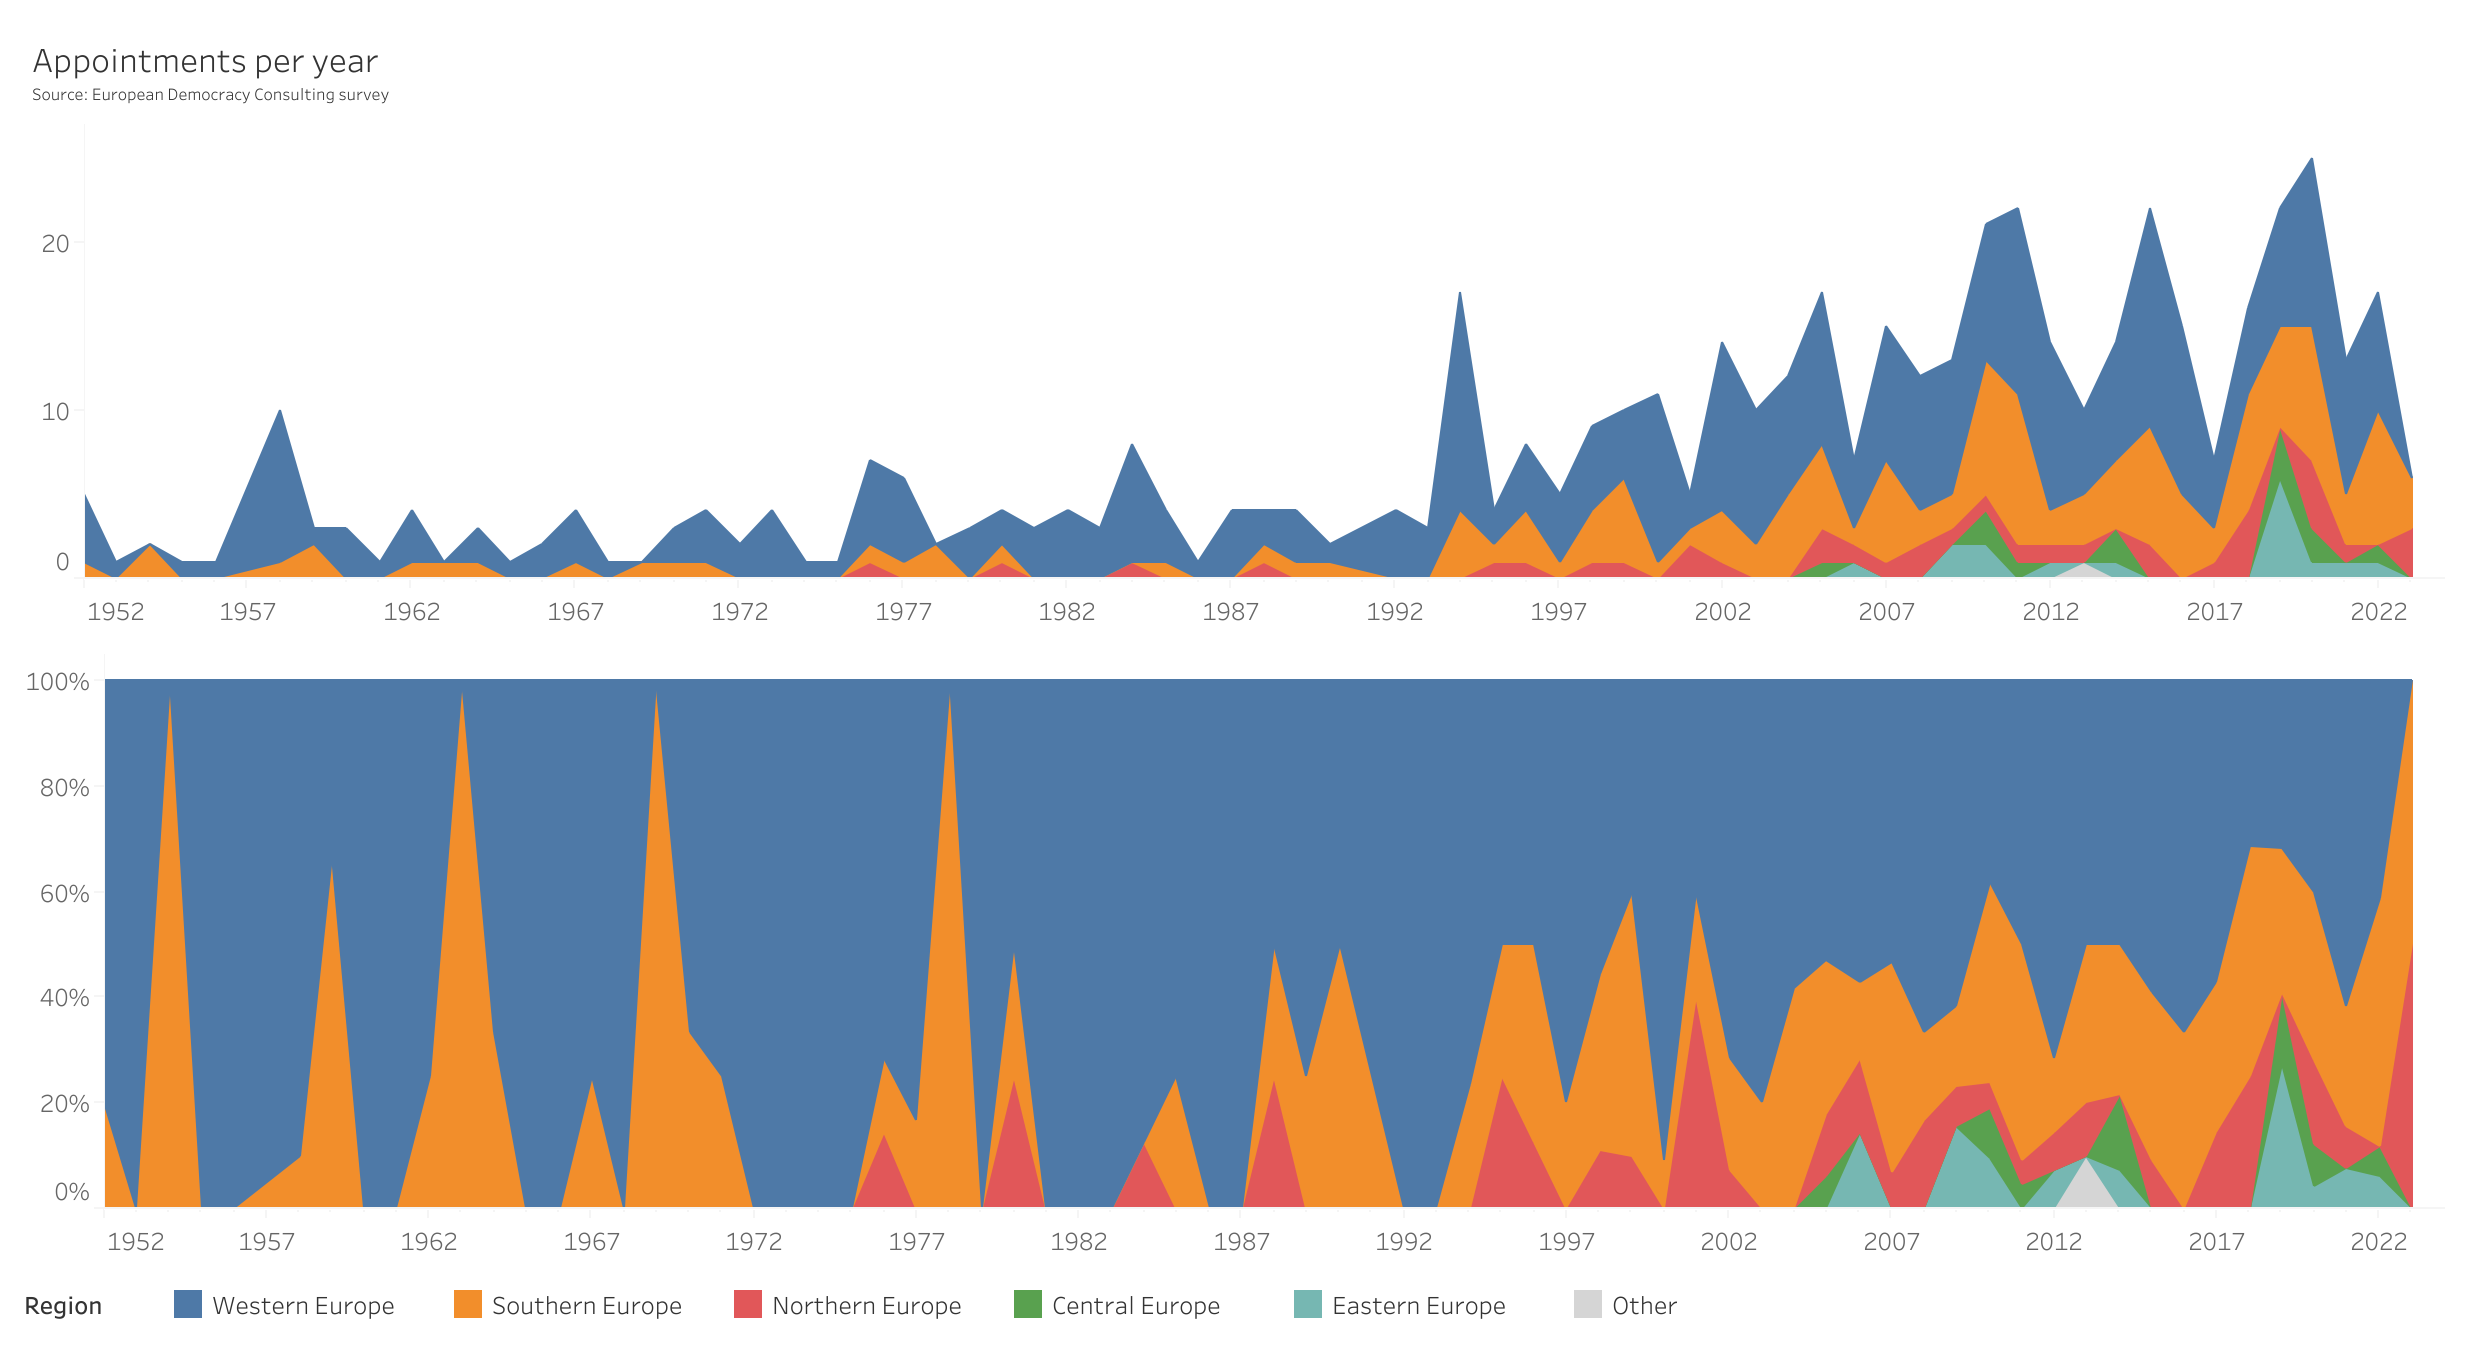
Overall figures
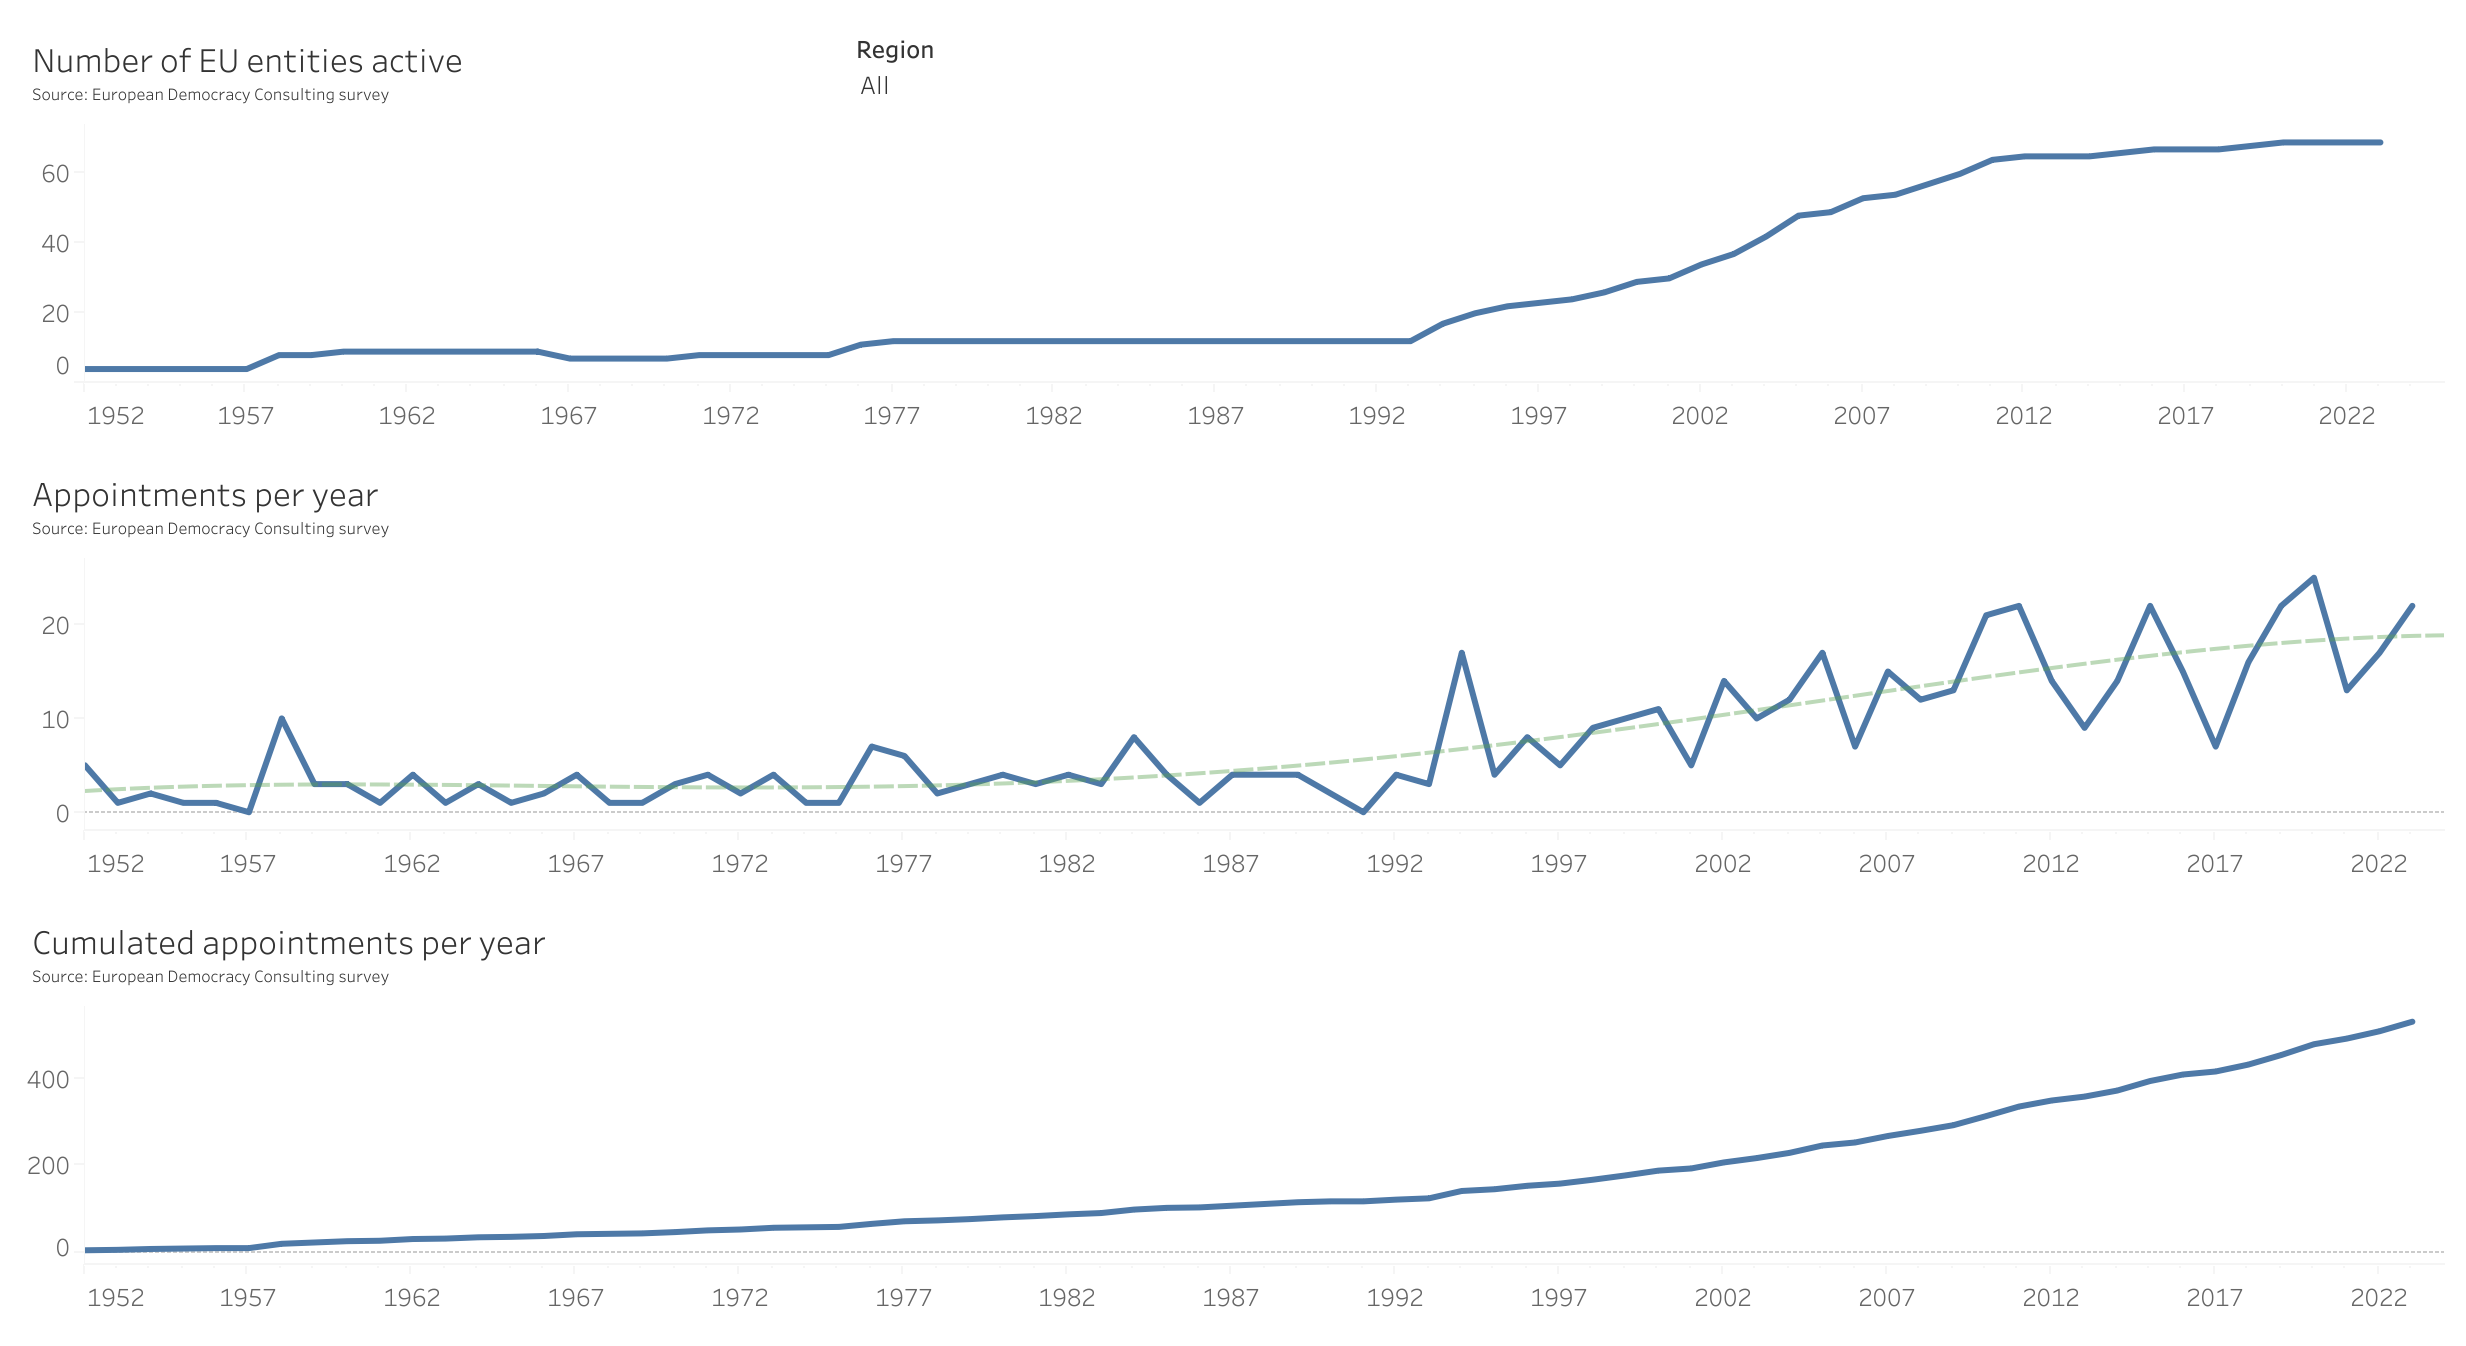
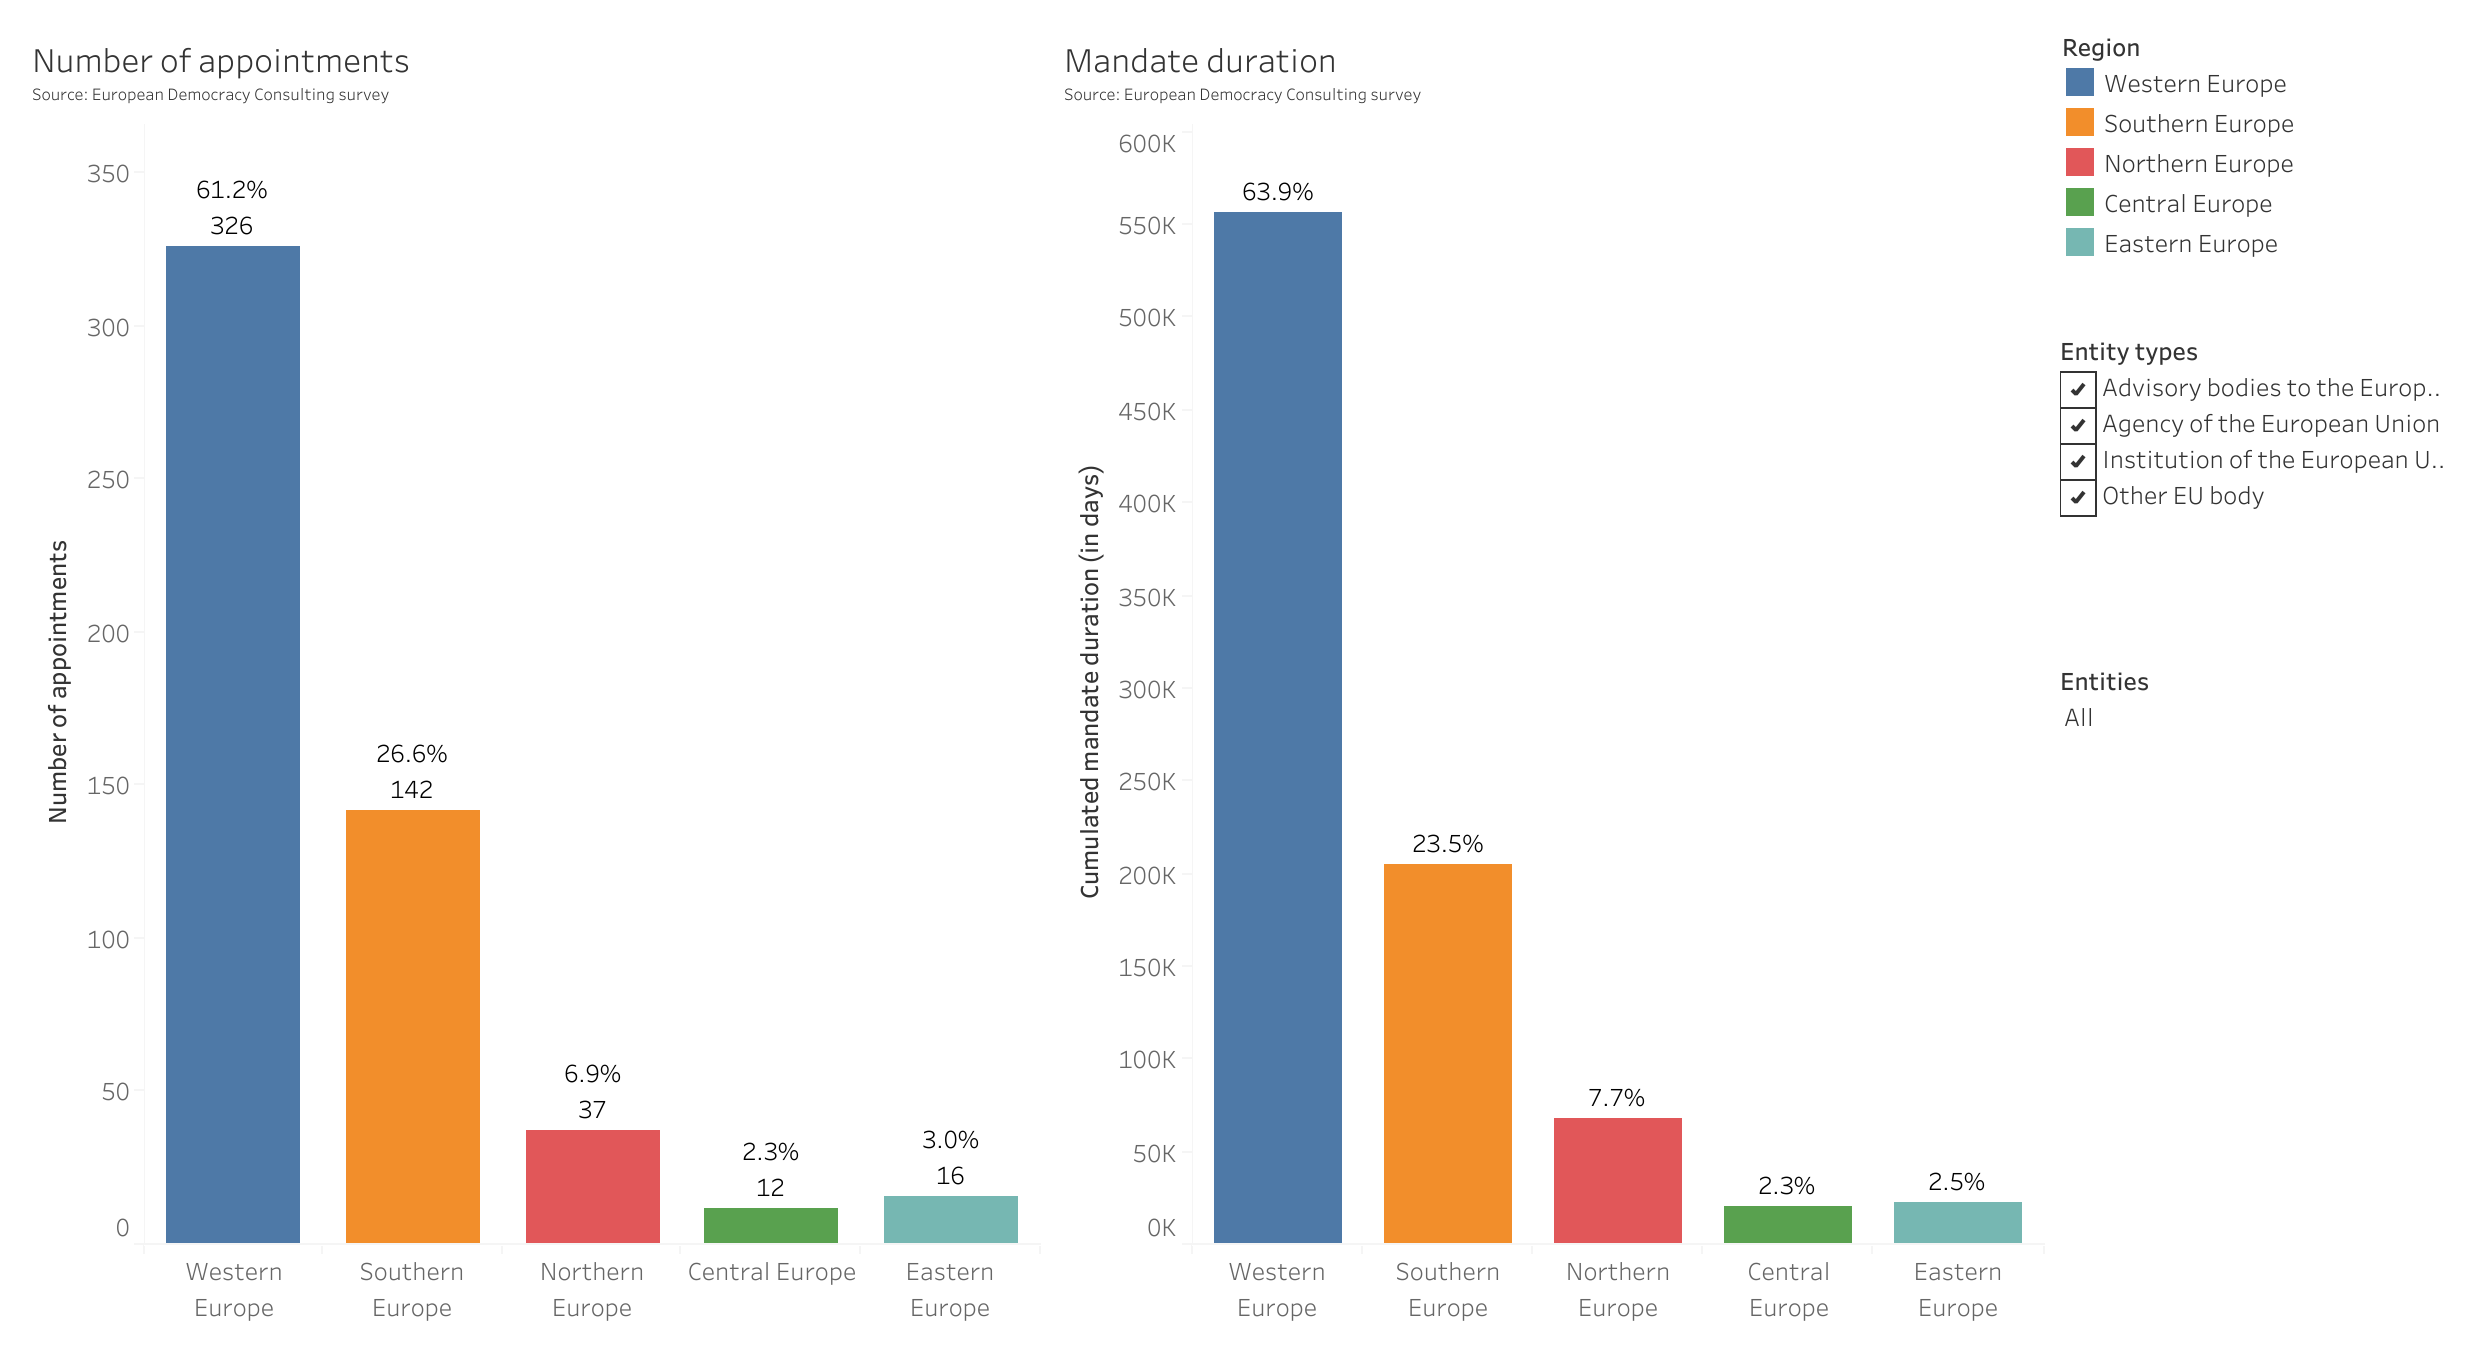
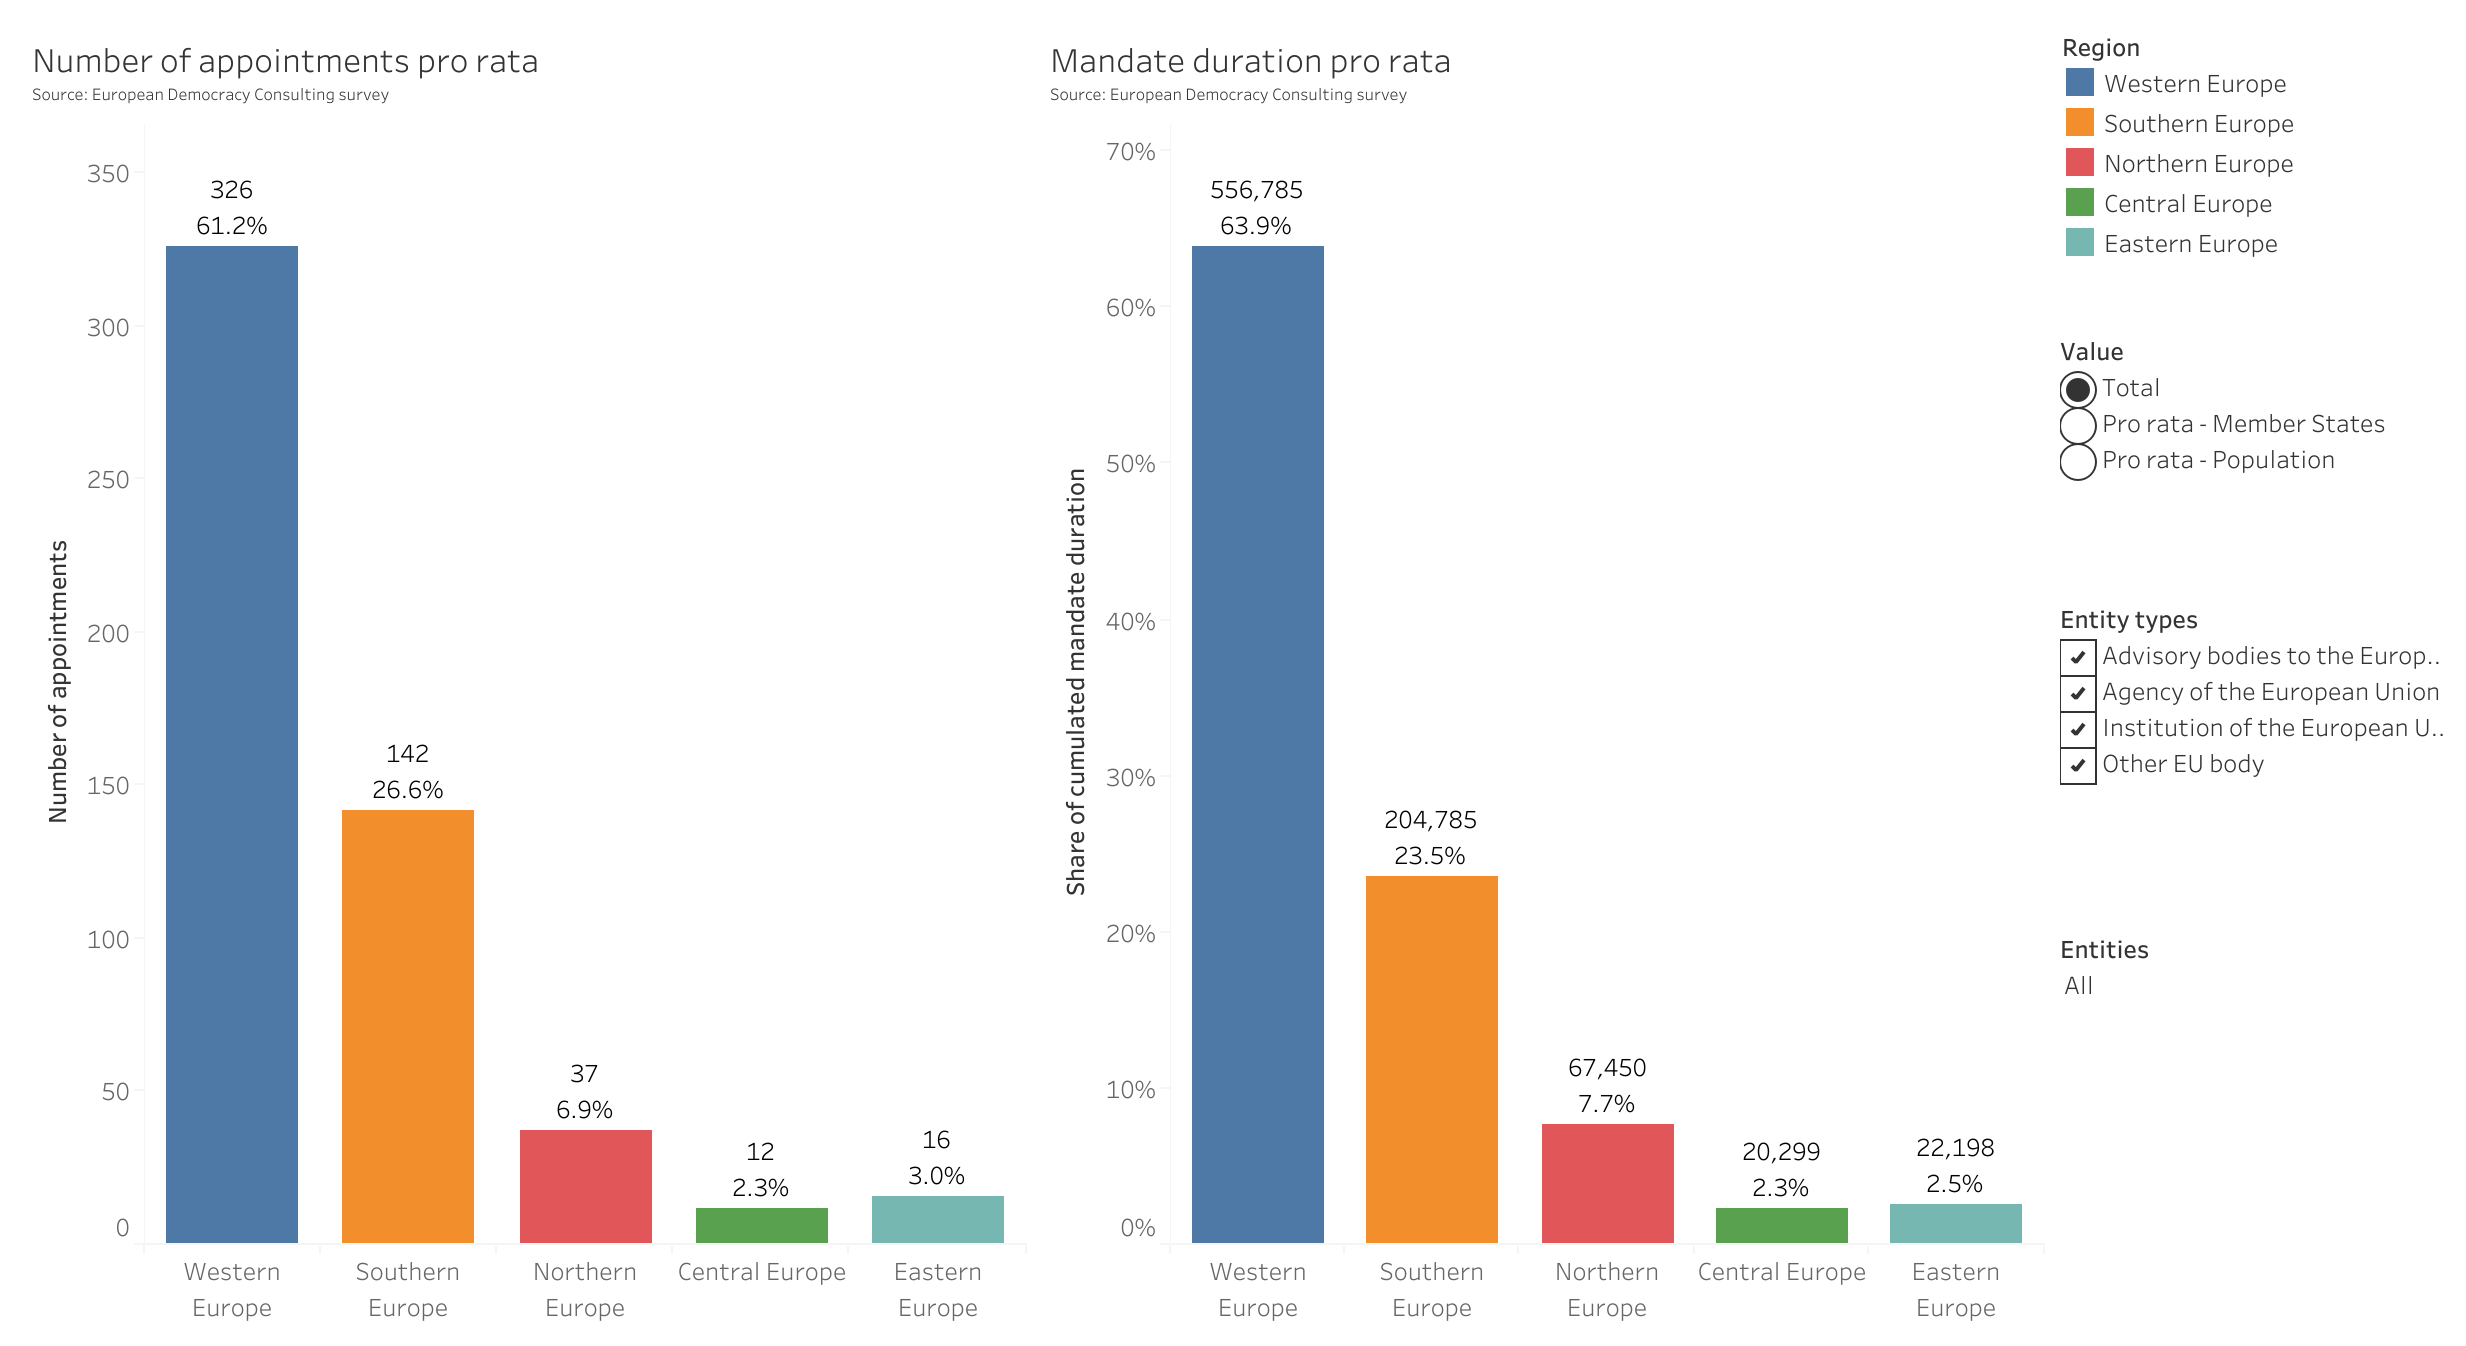
GRELO2024 starts with a general appraisal of total mandates (in the “total mandates” visualisation), and progressively refines its analysis of long-term data by accounting for the progressive expansion of the Union membership (the “mandates since” view focuses on more recent years), as well as for each of the five regions’ number of Member States and own population (the “mandates pro rata” allow comparisons pro rata of each region’s demography and number of States).
We find that focusing on recent years (whether from the 2004 EU enlargement, or even more recent years) only provides, at best, a limited re-balancing that does not affect general patterns of regional representation — regions remain far from equal in the representation of their citizens.
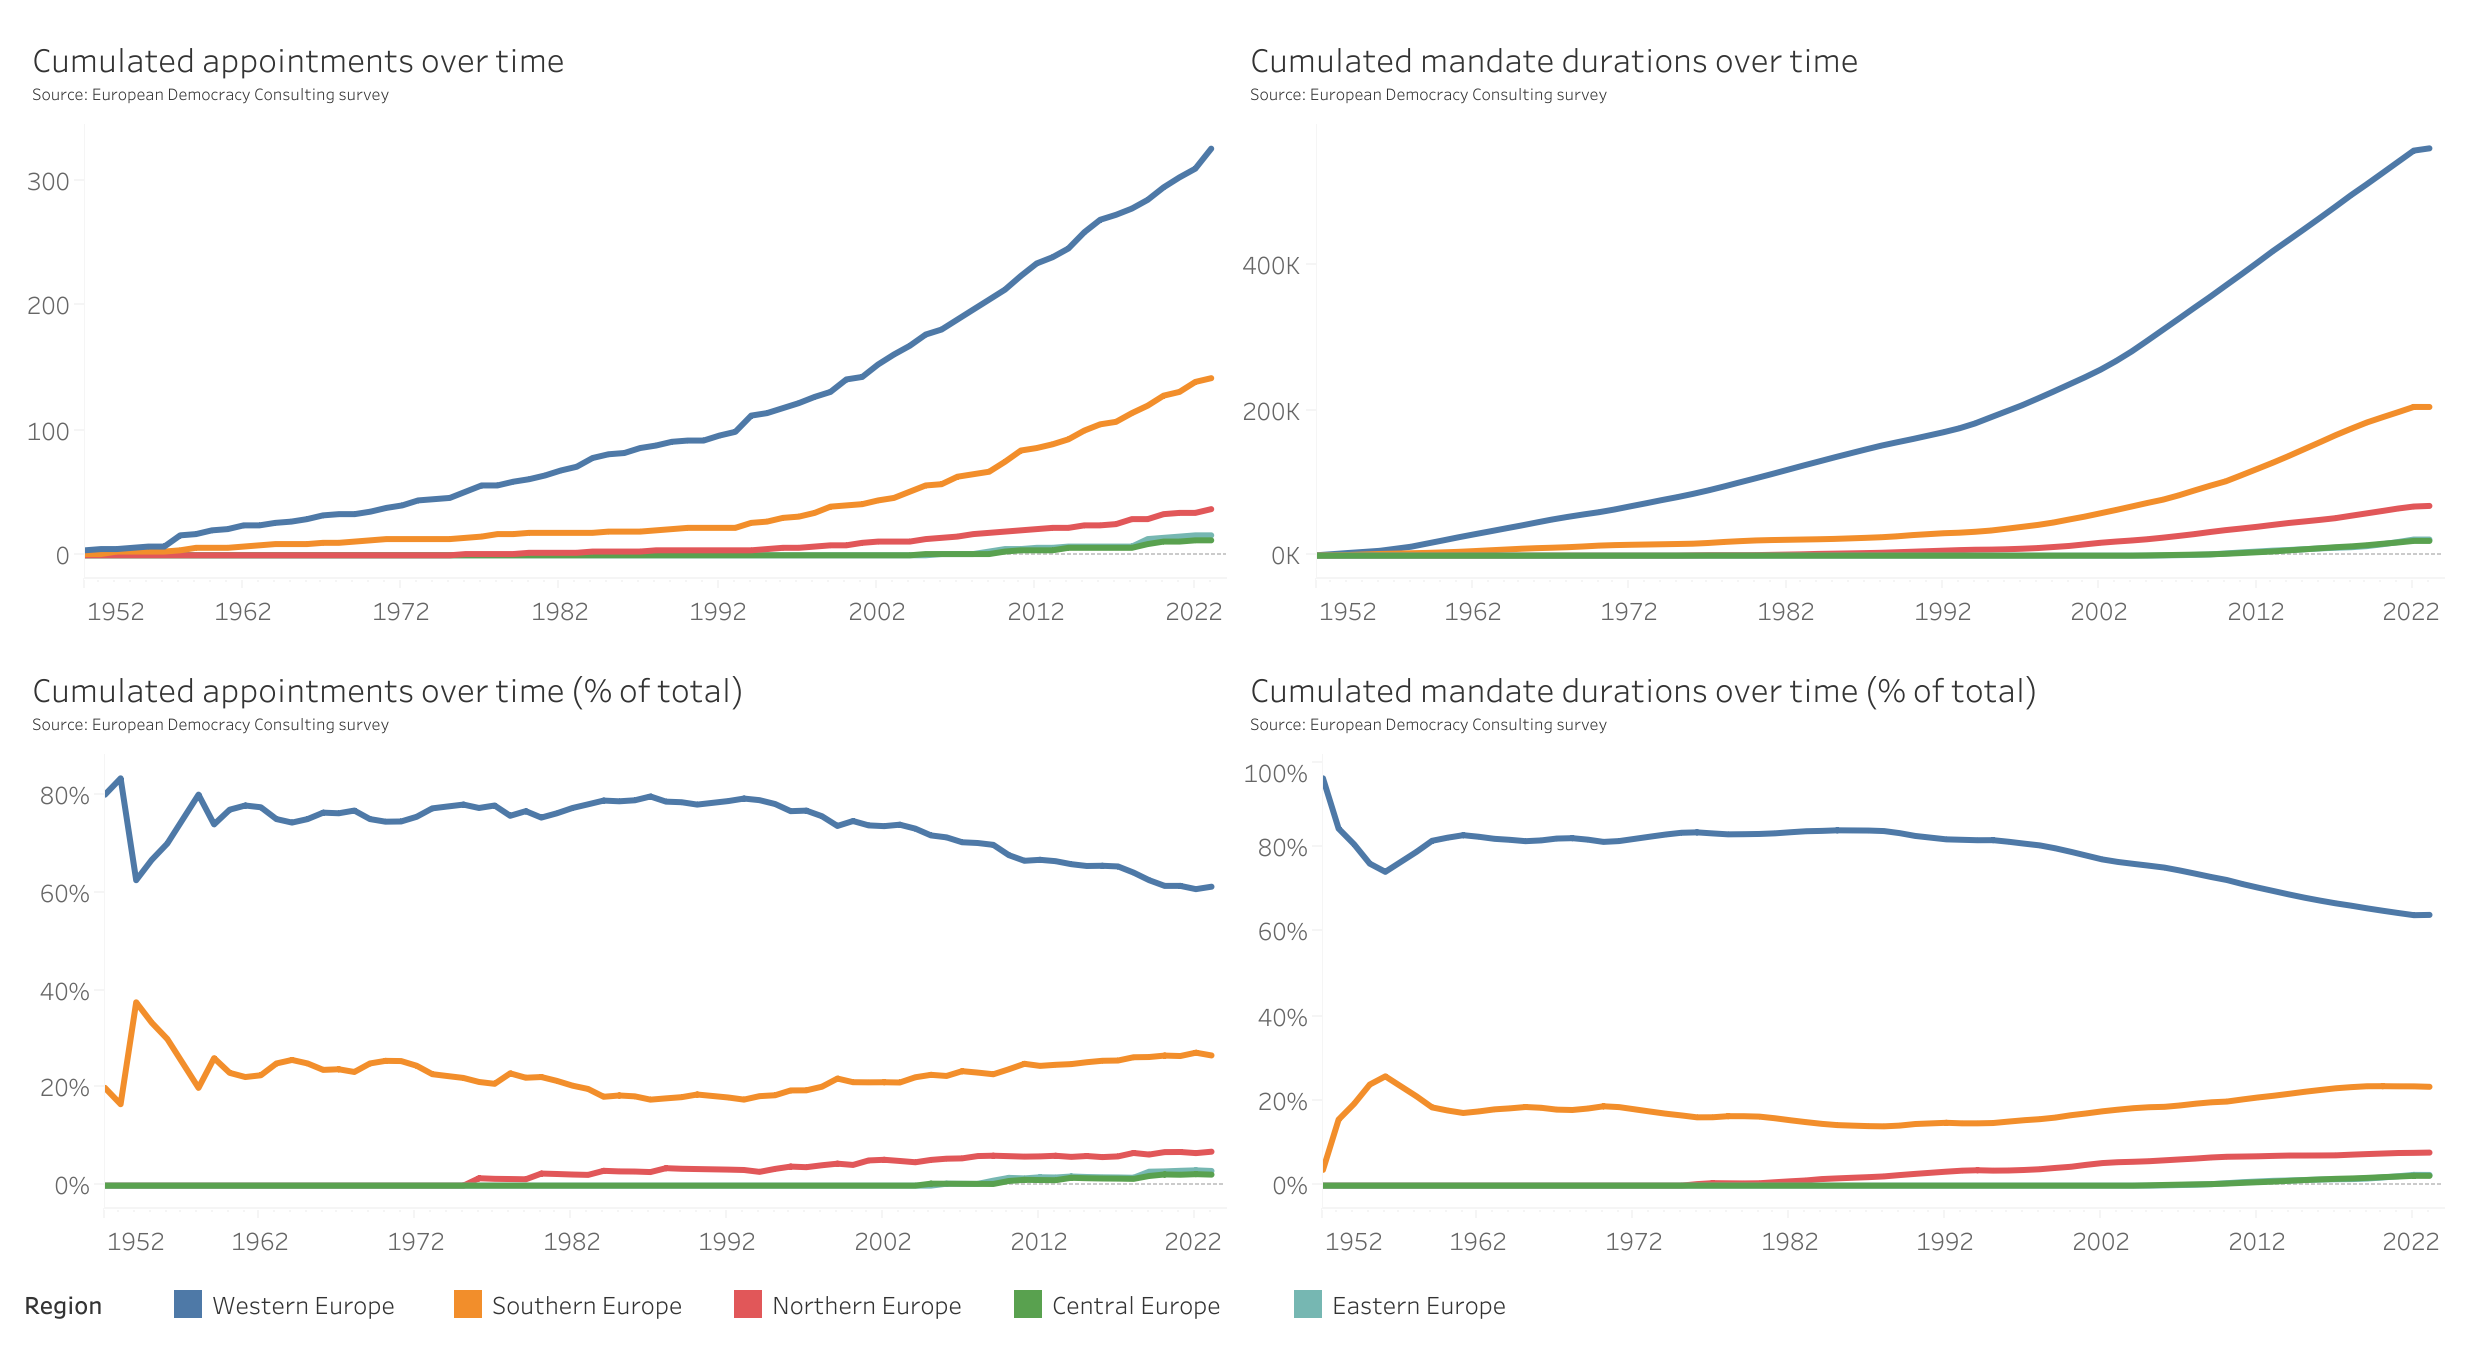
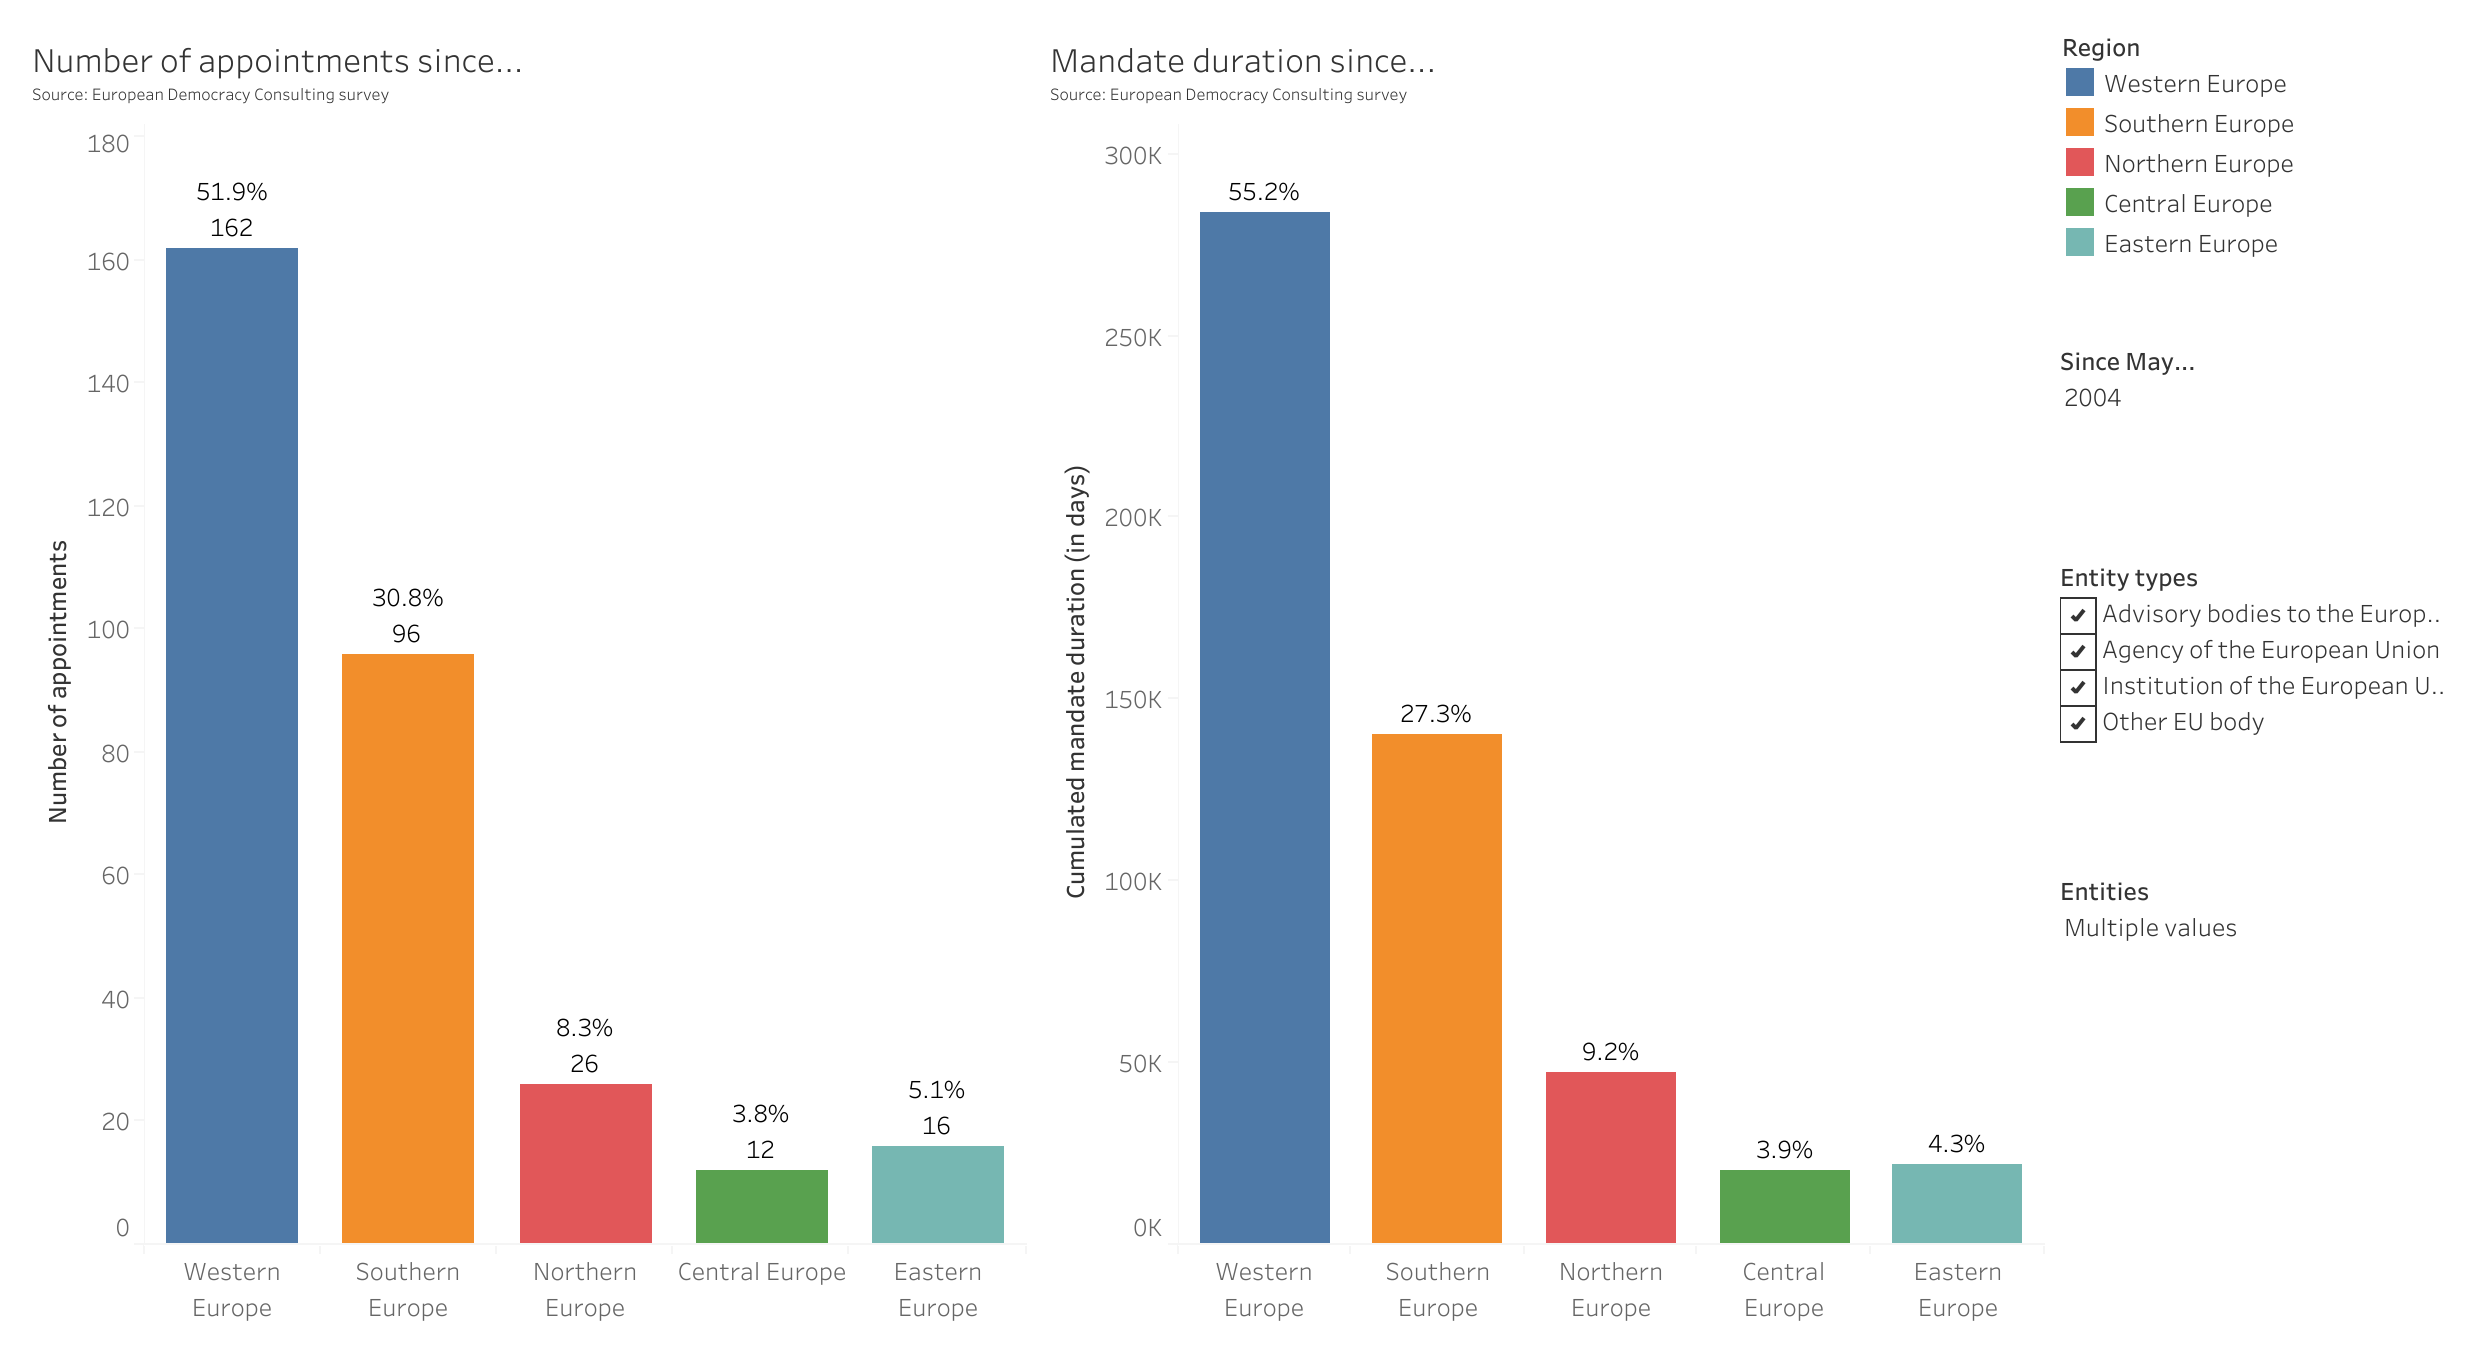
For instance, Western Europe has received over 60% of all appointments and mandate durations, while Southern Europe has captured another 25%. By looking at data since the enlargement of May 2004, Western Europe has still received between 50 and 55% of appointments and durations, and Southern Europe another 30%. Meanwhile, Central and Eastern Europe remain under 5%. Even for data since 2014, or ten years after most Central and Eastern Member States had joined, Western Europe retaines over 50% of appointments and durations and Southern Europe around 30%; meanwhile Eastern and Central Europe merely reach 5-6%.
In effect, only by looking at the most recent years and by accounting for regions’ demography do Central and Eastern Europe fare slighter better. Even then, the performance of Central and Eastern Europe remains very volatile, with values between 10 and 15% for Central Europe and between 5 and 10% for Eastern Europe.
With a maximum of 15.2% of all appointments made since May 2018 and pro rata of population sizes, Central Europe still does not reach its fair share — the 20% “equality mark” mentioned above —, while Eastern Europe reached a maximum of just 10.7% for appointments made since 2019, meaning only half of its fair share of appointments.
By contrast, Western and Southern Europe consistently exceed their fair share of representation in absolute terms and pro rata of their number of Member States. With regards to representation pro rata of their population, they hover around the 20% equality mark in recent years.
Finally, despite low overall numbers, Northern Europe almost reaches its fair share pro rata of its number of Member States, and obtains close to twice its fair share of representation when accounting for its limited population.
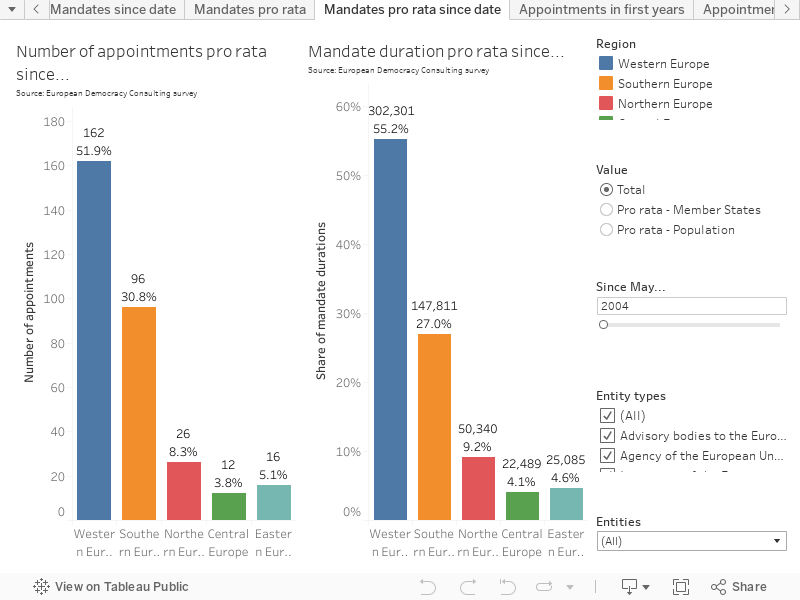
Link: https://public.tableau.com/app/profile/eudemocracy/viz/GRELO2024/Mandatesproratasincedate
Key figures
- Since May 2004, Western and Southern Europe have received, respectively, over 50% and over 30% of all new appointments. Figures remain largely unchanged for appointments made since 2012. Northern, Eastern and Central Europe see a progressive improvement of their situation in recent years but remain far below the 20% equality mark, often in the single digits. Even for the most recent appointments, Western and Southern Europe’s predominance remains even more pronounced for non-EU agency leadership positions — together receiving consistently over 80% of new appointments.
- Accounting for regions’ number of Member States, Western Europe and, to a lesser degree, Southern Europe maintain their dominance over appointments, retaining between 30 and 40% of appointments. By contrast, Central and Eastern Europe remain far behind, almost consistently under 10%.
- Accounting for regions’ population, Western and Southern Europe are more in line with their fair share of representation. Meanwhile, and with the exception of the most recent years, Northern Europe is consistently between 1.5 times and twice as represented as it should be for population-based equality. Central and Eastern Europe do see progressive increases, but their progress remains uneven and they remain consistently far below the equality mark; only by focusing on the most recent years does Eastern Europe reach 10%. Without EU agencies, both regions remain squarely stuck under 10%, leaving their citizens half as represented as they ought to be for population-based equality.
Additionally, our per-Member State overview of appointments within a fixed duration confirms that, with the exception of a few outliers, citizens from Central and Eastern European Member States received fewer appointments than citizens of other Member States following their Member State’s accession to the Union.
This conclusion remains true when factoring in Member States’ populations, and is even more explicit when accounting for the total number of appointments made — as the progressive increase in EU entities and, therefore, in the number of leadership positions to be filled makes it relatively easier to appoint citizens from all regions than it was, for instance, in the 1990s.
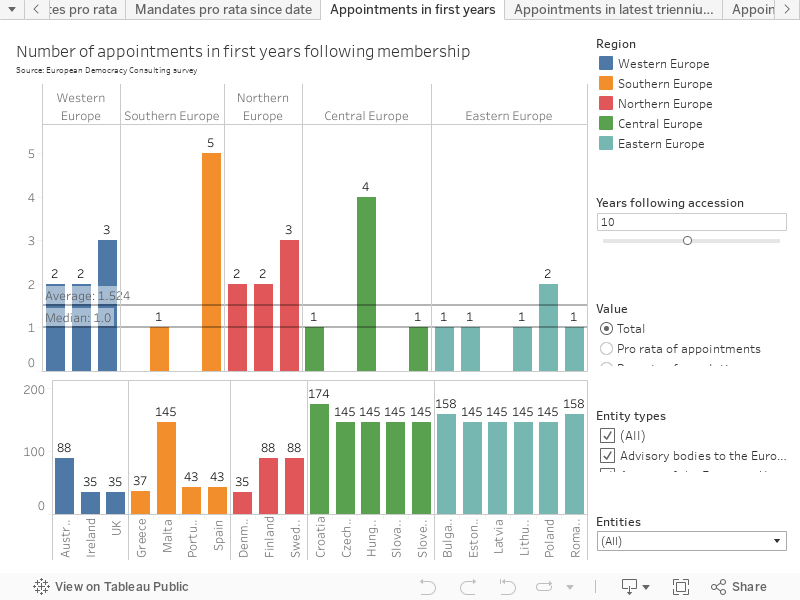
Link: https://public.tableau.com/app/profile/eudemocracy/viz/GRELO2024/Appointmentsinfirstyears
Key figures
- Three Member States from Southern Europe experienced a severe dry spell following their accession. While Portugal and Greece caught up since the second half of the 2000s, Cyprus (not displayed) remains awaiting for its first appointment, after almost nineteen years of membership.
- On average, Western and Northern Europe fare equally well and better than all other regions; Spain also fares particularly well, especially when compared to other Member States from Southern Europe.
- As expected, the total number of appointments within a fixed number of years following accession is much larger for Central and Eastern European Member States than for earlier accessors to the EU.
- On average, Central and Eastern Europe lag behind, especially when factoring in the total number of appointments made. Poland, Hungary and, more recently, Romania fare slightly better in absolute numbers, while Estonia and Slovenia get ahead when accounting for their limited populations.
Finally, a more qualitative analysis of appointments by type of entity shows that the appointments received by citizens of Central and Eastern Europe are overwhelmingly for less public or prestigious positions — with agency positions accounting for, respectively, 83% and 69% of appointments for citizens from Central and Eastern Europe. Conversely, EU agencies only account for just over a third of appointments received by citizens from Western and Southern Europe. To this date, no Central European citizen has ever been appointed to any of the positions recorded for EU institutions, nor for our category of “Other EU bodies”.
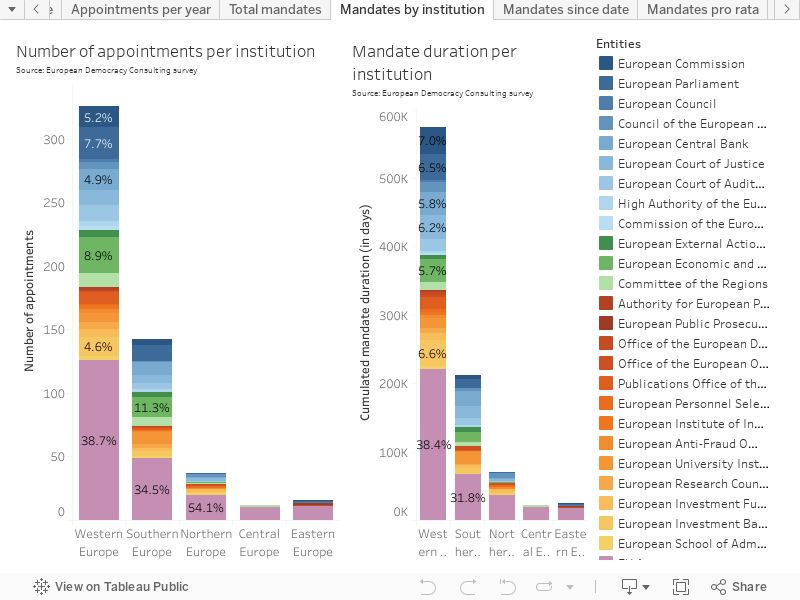
Link: https://public.tableau.com/app/profile/eudemocracy/viz/GRELO2024/Mandatesbyinstitution
Key figures
- 30% of Western Europe’s appointments were to leadership positions of EU institutions; this is down to 19% for Northern Europe and 0% for Central Europe.
- Advisory and other bodies made up 37 and 31% of Southern and Western Europe’s appointments, but only 17 and 13% for Central and Eastern Europe.
- EU agencies — often the least visible EU entities — represented only 39 and 35% of Western and Southern European appointments, but 83 and 69% for Central and Eastern Europe.
Overall, we see that the analysis of appointments to leadership positions is affected by a number of factors: a region’s number of Member States, its population, the amount of time since the accession of its Member States, the number of years taken into account, and the categories of entities considered.
However, despite changes in figures, one constant trend remains: the clear and continued under-representation of citizens of Central and Eastern Europe within the EU’s leadership, in particular in the most public and visible leadership positions.
Let us now see take a closer look at recent appointments, in particular those of the year 2023 and of the 2021-2023 triennium.
2023 figures and recent trends
While limited time has passed since the first GRELO publication, in January 2021, this 2024 update aims at taking stock of recent appointments and trends. In particular, we will review mandates starting and ending in the calendar year 2023, as well as in the 2021-2023 triennium — the use of trienniums, as a complementary view to calendar years, is meant to even out year-on-year volatility that is not statistically relevant.
We recall that a number of recent appointments, decided in late 2023 but only taking effect in January 2024, such as that of European Investment Bank president Nadia Calviño, are not accounted for — though they do appear in our dataset for reference.
Mandate evolution in 2023
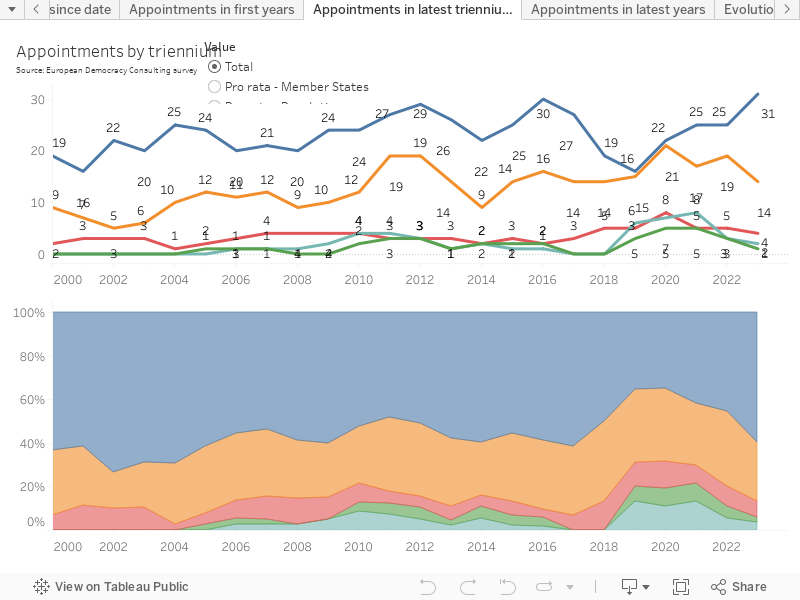
For the year 2023, European Democracy Consulting identified 22 appointments — five more than in 2022, or a 29% increase.7
- Two for EU institutions: Alessandro Chiocchetti as Secretary-General of the European Parliament, and Piero Cipollone as Executive board member for the European Central Bank;
- One for EU advisory bodies: Oliver Röpke as President of the European Economic and Social Committee;
- Three for Other EU bodies: Marjut Falkstedt as Chief Executive of the European Investment Fund, Barbara Balke as Secretary-General of the European Investment Bank, and Anna Mitelman as Head of the European School of Administration; and
- Sixteen for EU agencies: the Euratom Supply Agency (ESA), the Education, Audiovisual and Culture Executive Agency (EACEA), the European Union Agency for Criminal Justice Cooperation (Eurojust), the European Border and Coast Guard Agency (FRONTEX), the European Climate, Infrastructure and Environment Executive Agency (CINEA), the European Environment Agency (EEA), the European Joint Undertaking for ITER and the Development of Fusion Energy (F4E), the European Training Foundation (ETF), the European Union Agency for the Operational Management of Large-Scale IT Systems in the Area of Freedom, Security and Justice (eu-LISA), the European Union Aviation Safety Agency (EASA), the European Union Institute for Security Studies (EUISS), the European Union Intellectual Property Office (EUIPO), the Single Resolution Board (SRB), and the European Union Agency for Fundamental Rights (FRA).
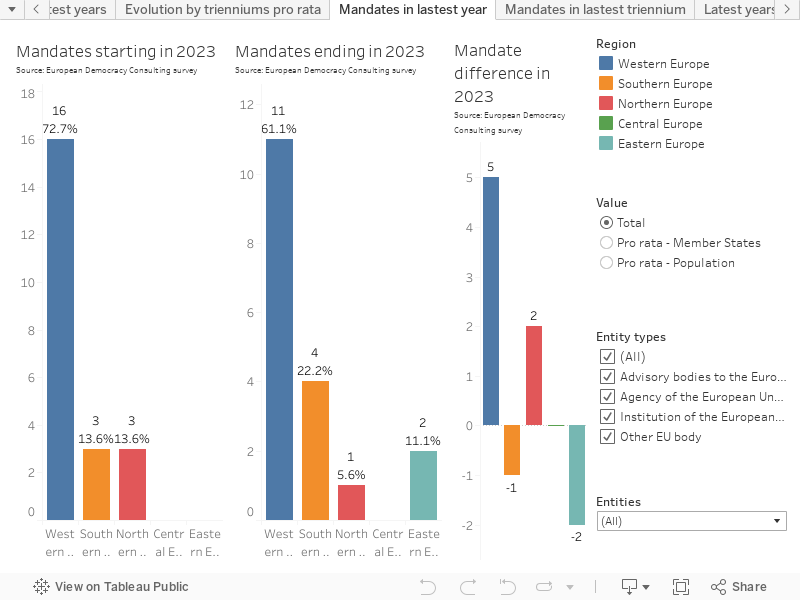
Out of these 22 new mandates, 16 (or 73%) went to Western Europe, 3 to Southern Europe and to Northern Europe (14% each), and none to Central or Eastern Europe. When calculating pro rata of each region’s number of Member States, the distribution remains broadly the same. When calculating pro rata of each region’s population, Western Europe remains over 1.5 times over-represented, while Northern European reaches almost three times its fair representation; meanwhile, of course, Central and Eastern Europe remain unrepresented.
Beyond new appointments, a complementary information is that of the number of mandates ending in 2023. European Democracy Consulting recorded 18 mandates ending in 2023 – down from 19 in 2022: 11 for Western Europe (61%), 4 for Southern Europe (22%), 1 for Northern Europe (6%), two for Eastern Europe (11%), and none for Central Europe.
Overall, the number of EU leadership officer-holders jumped by 5 for Western Europe (clearly increasing its over-representation), decreased by 1 for Southern Europe (decreasing its over-representation), increased by 2 for Northern Europe (increasing its over-representation), and decreased by 2 for Eastern Europe (worsening its under-representation). With a net-zero change, Central Europe maintains its under-representation.
Link: https://public.tableau.com/app/profile/eudemocracy/viz/GRELO2024/Mandatesinlastestyear
Key figures
- With 73% of appointments in 2023 (up from in 41% 2022) and a net increase of 5 citizens in leadership positions, Western Europe dramatically increases its dominance.
- Accounting for regions’ populations, Northern Europe is almost three times as represented as its fair share.
- Central and Eastern Europe saw none of their citizens appointed to a leadership position, increasing their under-representation. Eastern Europe’s representation was made worse by the end of mandates of two of its citizens.
Mandate evolution in the 2021-2023 triennium
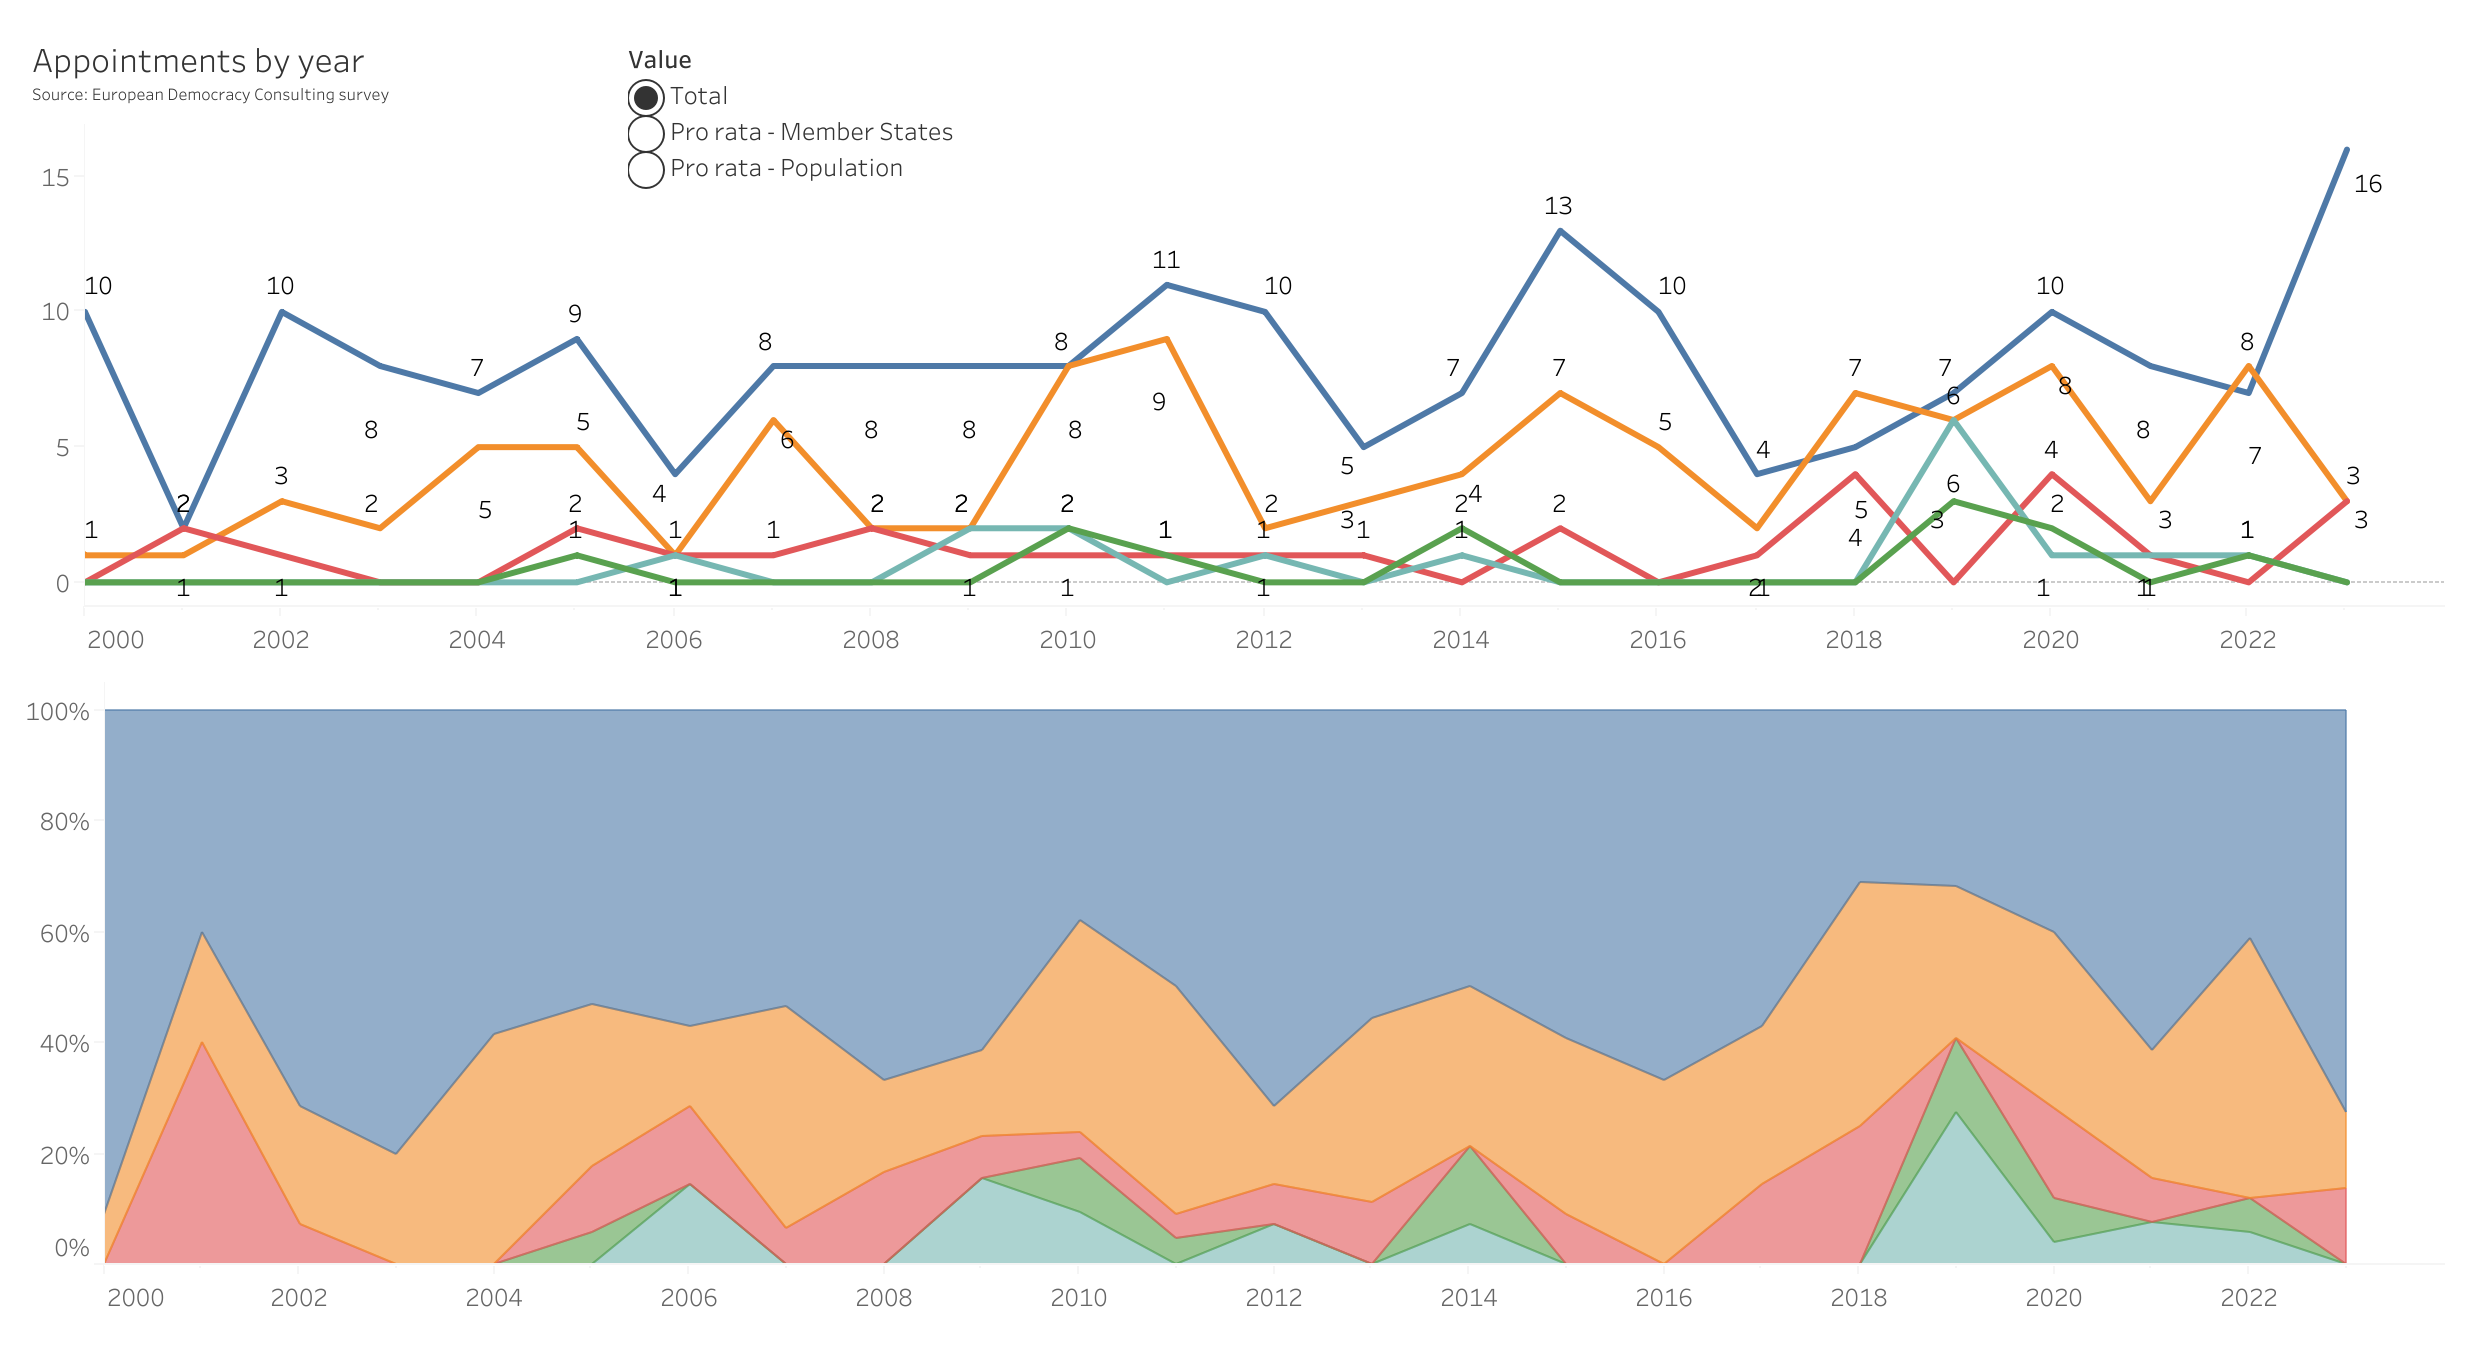
Of course, while appointments in individual years matter, it is statistically difficult to extract trends from such small samples. This is why GRELO also analyses appointments in running three-year brackets, known as “trienniums”, between 2000 and 2023 (1998-2000, 1999-2001, etc., 2021-2023), in an attempt to smooth year-on-year volatility caused by limited numbers of appointments per year.
Over the 2021-2023 triennium, European Democracy Consulting recorded 52 new mandates (similar to the 55 recorded for the 2020-2022 triennium), making the data more statistically significant.
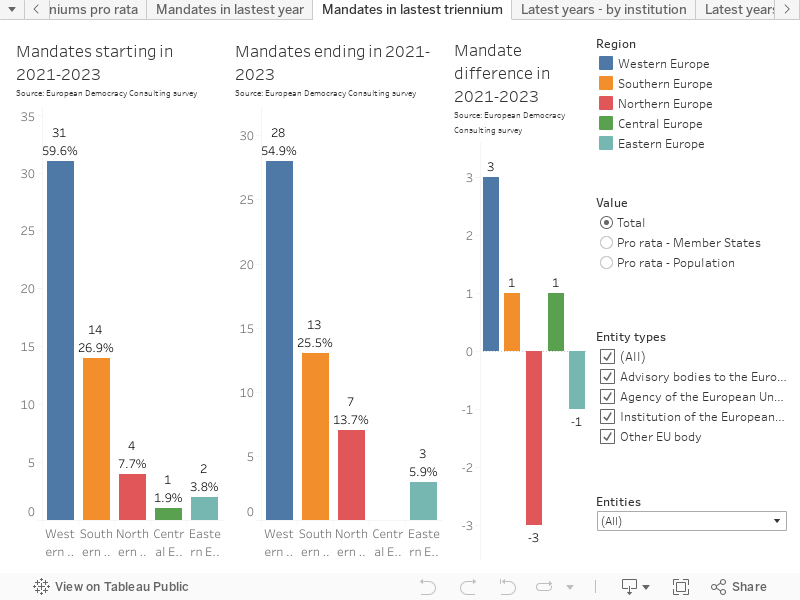
Analysis of the 2021-2023 triennium is in keeping with 2023 itself, but provides slightly more balance. Overall, citizens from Western Europe still received three times their fair share of appointments (with 31 appointments, or 60%), and those of Southern Europe remain solidly above the 20% equality mark (with 14 appointments, or 27%). Unlike for the 2020-2022 triennium, Central and Eastern Europe only receive one and two appointments each (or under 2% and 4%, respectively); this compares to around 6% each for 2019-2021, and 8 and 13% for 2018-2020.
Pro rata of each region’s number of Member States, the distribution remains largely similar, with Western Europe dominating with 51% of appointments, almost twice the appointments of Southern Europe, itself still anchored above the equality mark (at 27%). Northern Europe remains below its fair representation (under 16%), while Central and Eastern Europe lag far behind (with just over 2 and under 4%).
As always, the calculation pro rata of each region’s number of citizens is more balanced, but clear discrepancies remain. Western and Northern Europe remain over 1.5 times over-represented, at 31 and 36%, while Southern Europe just passes the equality mark, with 21%. Meanwhile, Central and Eastern Europe remain in the single digits, each around 6%.
In the same time frame, European Democracy Consulting recorded 51 mandates ending (similar to 52 for the 2020-2022 triennium), mostly for citizens of Western and Southern Europe (28 and 13, respectively). As a result, Northern Europe loses three office-holders (slightly decreasing its over-representation), while Western, Southern and Central Europe gain three, one and one citizens, respectively. Finally, Eastern Europe gets a net decrease of one citizens, furthering its under-representation.
Link: https://public.tableau.com/app/profile/eudemocracy/viz/GRELO2024/Mandatesinlastesttriennium
Key figures
- While disparities are not exactly as pronounced, Western and Southern Europe still capture 87% of all appointments, and 89% of all non-EU agency positions (Northern Europe alone accounting for the remaining 11%).
- All other regions remain far below the equality mark, with under 8% for Northern Europe and under 2 and 4% for Central and Eastern Europe; this is a marked drop from the two previous trienniums, with Eastern Europe scooping up over 13% of appointments in 2018-2020.
- Accounting for regions’ number of Member States, Western and Southern Europe still receive over 78% of appointments; Northern Europe remains below the equality mark, while Central and Eastern Europe barely move.
- Accounting for regions’ populations, Southern Europe sits just above the equality mark, but Western Europe remains notably over it, at over 31%. Northern Europe receives close to 1.8 times its fair representation. Finally, Central and Eastern Europe remain far behind, still in the single digits with around 6% each.
- Over the triennium, Northern Europe continues its losses, and Western Europe again emerges as the clear winner following several trienniums of growth.
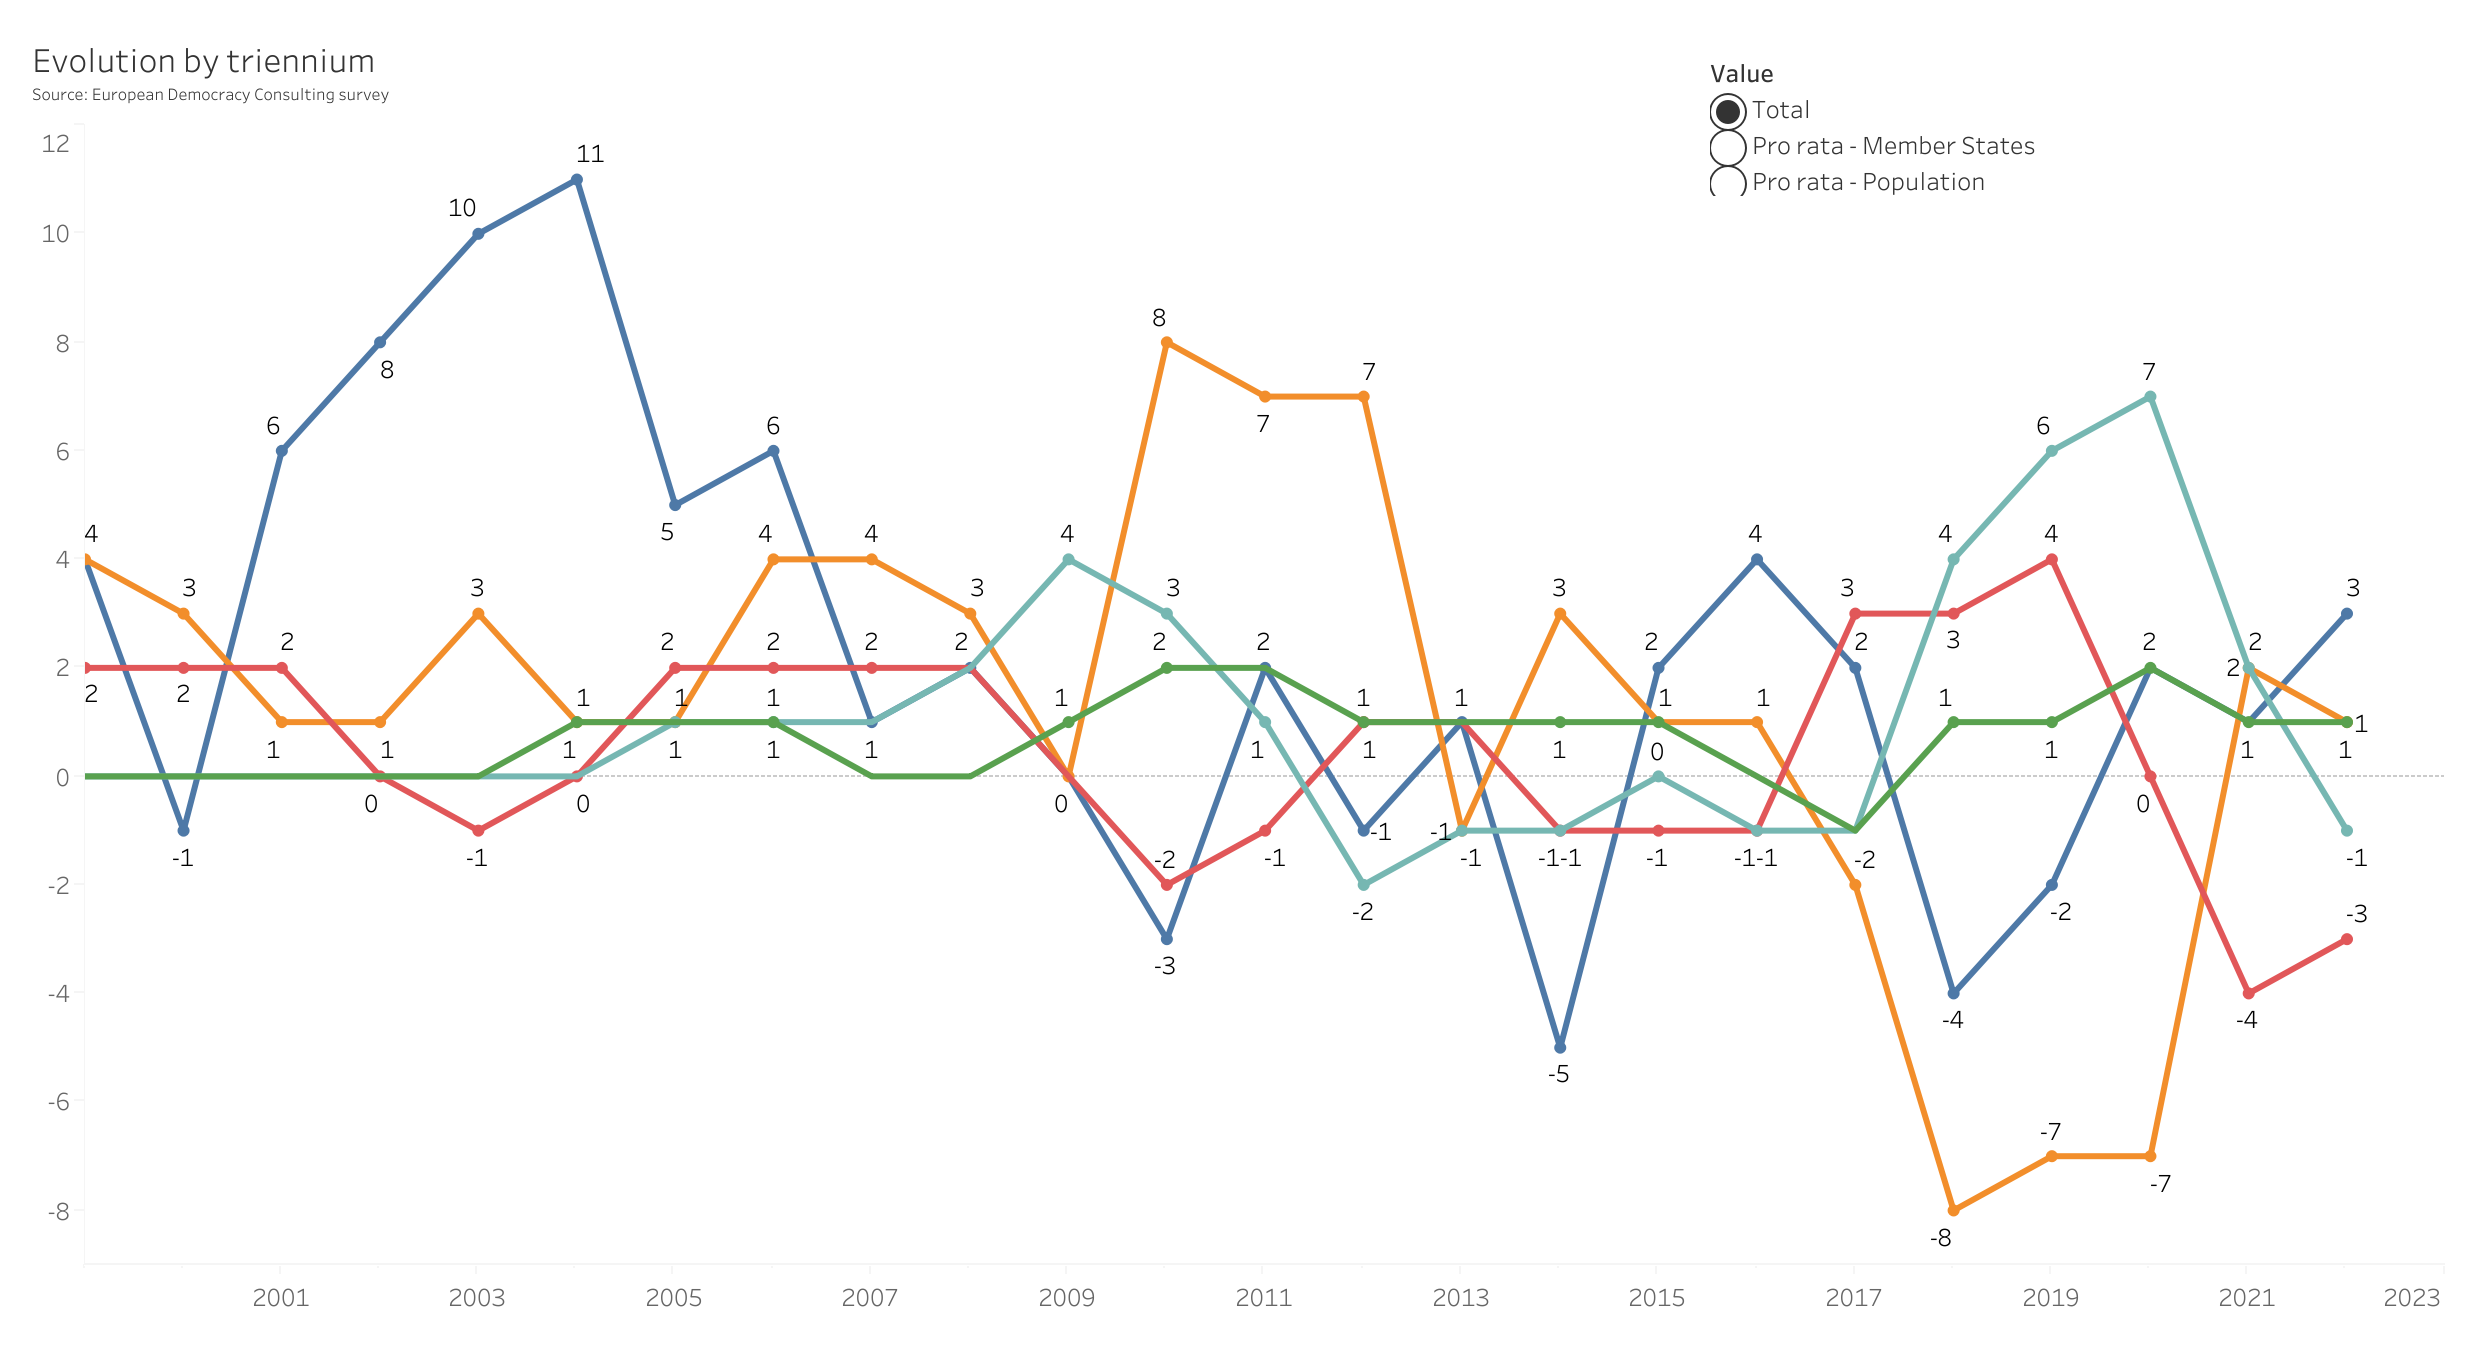
Overall, as our evolution of appointments by trienniums shows, Western Europe is riding high for the fourth triennium in a row, at the clear expense of all other regions. Southern Europe see-saws and returns to previously lower levels of representation, while Northern, Central and Eastern Europe see their representation crumble. This is particularly concerning for the latter two regions, which had finally experienced a mild growth in representation several trienniums ago.
Link: https://public.tableau.com/app/profile/eudemocracy/viz/GRELO2024/Appointmentsinlatesttrienniums
Mandate evolution by entity
Beyond the sheer number of mandates starting and ending in a given year or triennium, it is also interesting to analyse appointments by entity.
As recalled above, previous GRELO editions showed the prevalence of less prestigious, and therefore less visible, appointments for Central and Eastern Europe — with Central Europe receiving, overall, over 83% of its appointments from EU agencies and the remaining 17% from advisory bodies. By contrast, Western and Southern Europe receive just under a third of their appointments from EU institutions — arguably the most prestigious and publicly visible positions — and slightly over a third from EU agencies.
Given the limited number of appointments per year, figures for 2023 are not very statistically relevant, especially since no citizens from Central or Eastern Europe were appointed to any positions. Figures for 2021-2023 are more relevant, but nevertheless show sharp contrasts and must be handled with care.
At this point, it is important to reiterate that we do not consider agency leadership positions less important than any other leadership appointments. However, the more prestigious and visible a position, the more European citizens are likely to be aware of the office-holder’s appointment, and the more it contributes to the feeling of representation of the citizens of the same Member State or region as the office-holder.
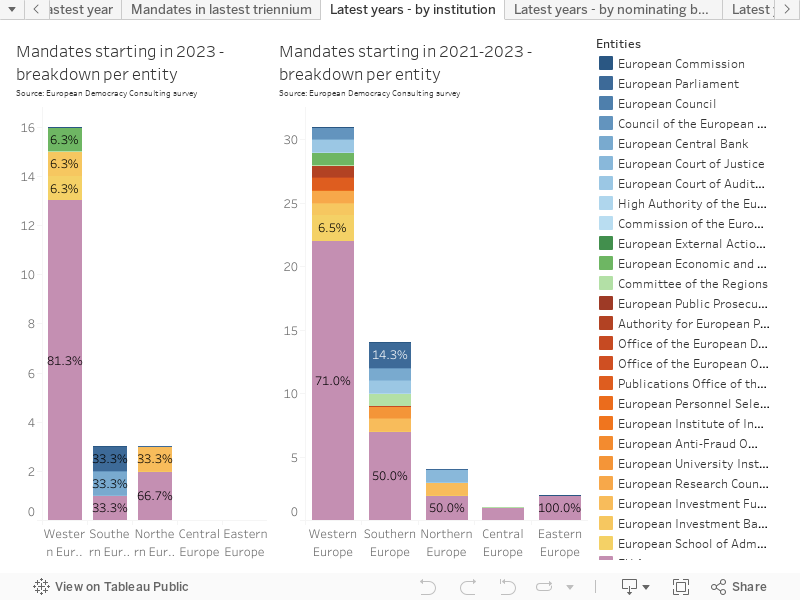
Our data shows that, between 2021 and 2023, leadership positions of European institutions formed close to 29% of all appointments for citizens of Southern Europe, 25% for Northern Europe, and above 6% for Western Europe — but 0% for Central and Eastern Europe. Conversely, leadership positions of EU agencies accounted for 50% of appointments for Southern Europe and Northern Europe, and 71% for Western Europe, but 100% for both Central and Eastern Europe — meaning that, over the past three years, not a single citizen from Central or Eastern Europe was elected to a non-agency leadership position.
Therefore, despite the amount of time since the accession to the Union of even its most recent members (the 2004 EU enlargement to Central and Eastern Europe was almost 20 years old in 2023 and Croatia, the EU’s newest member, joined a decade ago), we note that the breakdown of appointments by entity for the latest triennium is similar to, or worse than, overall values. This seems to indicate that little has actually been accomplished in terms of appointing citizens from Central and Eastern Europe to the positions most visible to European citizens — an essential element for the construction of a sense of belonging and integration.
Link: https://public.tableau.com/app/profile/eudemocracy/viz/GRELO2024/Latestyears-byinstitution
Key figures
- For 2021-2023 triennium, EU agencies accounted for the entirety of appointments received by citizens of Central and Eastern Europe.
- By contrast, positions in EU agencies “only” accounted for 50% of appointments for Southern and Northern Europe over the triennium, while appointments to EU institutions accounted 29 and 25%, respectively.
Who is responsible?
The first three recommendations formulated by GRELO2021 were to acknowledge the lack of proper geographical representation in the EU’s leadership, to acknowledge the likely negative impact of this lack of geographical representation, and to acknowledge the Council and Commission’s central role in appointments and, consequently, in the improvement of geographical representation.
Given this central role, the Council and the Commission are the ones who ought to acknowledge the above, before deciding on corrective and remedial action. But just how central is this role? How can we attest of these two bodies’ predominant role in the appointment of EU leaders?
Appointments by nominating body
In order to answer this question fully, we must look at the nomination processes for the entities observed. The choice of EU leaders is, broadly speaking, made either by nomination or by election. Given the functioning of the European Union, the lines between nomination and election are often blurred: in many instances, an individual is, in name, elected but, in practice, the decision is the result of discussions and compromises, and competing candidates drop out before the vote. Likewise, official announcements often indicate that an individual was nominated or appointed, even when the official mechanism included an election.
More about appointment/election modalities
Institutions of the European Union
- European Commission. The President of the European Commission is nominated by the European Council as part of the EU’s “top jobs” following European elections. Despite being subject to approval by the European Parliament, the decision-making process of 2019 clearly showed the European Council’s upper hand. The Secretary-General of the European Commission is nominated by the President of the Commission.
- European Council/Council of the European Union. The President of the European Council is nominated by the European Council as part of the EU’s “top jobs”. The Secretary-General of the Council of the European Union — the General Secretariat of the Council assists both the European Council and the Council of the EU — is nominated by the Council.
- European Parliament. The President of the European Parliament is elected by Members of the European Parliament. The Secretary-General of the European Parliament is nominated by the President of the European Parliament.
- European Central Bank. The President of the European Central Bank is nominated by the European Council as part of the EU’s “top jobs”. The Vice-President and other members of the Executive Board of the European Central Bank are also all appointed by the European Council.
- Court of Justice of the European Union/European Court of Justice. The President, Vice-President and Registrar are elected by the members of the Court.
- European Court of Auditors. The President and the Secretary-General of the European Court of Auditors are elected by the members of the Court.
Advisory bodies to the European Union
- European External Action Service. The High Representative/Vice President (HR/VP) is nominated by the European Council as part of the EU’s “top jobs”. The Secretary-General of the European External Action Service is nominated by the HR/VP.
- Committee of the Regions. The President of the Committee of the Regions is elected by the CoR Assembly. The Secretary-General of the Committee of the Regions is nominated by the CoR Bureau.
- European Economic and Social Committee. The President of the European Economic and Social Committee is elected by the EESC Plenary. The Secretary-General of the European Economic and Social Committee is nominated by the EESC Bureau.
Other EU bodies
Given the wide differences in statutes between the entities of this category, the modalities for elections and nominations are very variable. Several entities are directly under the remit of an EU institution; for instance, the European Commission, which appoints the Director of the European Personnel Selection Office, the President and Secretary-General of the European Research Council, the Head of the European School of Administration, and the Director-General of the Publications Office of the European Union. Likewise, the European Parliament elects the European Ombudsman.
On the other end of the spectrum are entities endowed with boards (whether a Governing Board, Board of Directors, High Council, etc.) tasked with the nomination of the entity’s top leadership, such as the Director of the European Institute of Innovation and Technology, the President of the European Investment Bank, the Chief Executive of the European Investment Fund, or the President of the European University Institute. Oftentimes, the Secretary-General of these entities will in turn be nominated by the top leadership, as for the Secretaries-General of the European Investment Bank, European Investment Fund, or European University Institute.
Finally, a number of entities share their accountability to two or more EU institutions. For instance, the European Chief Prosecutor and the European Data Protection Supervisor are appointed jointly by the European Council and the European Parliament. Likewise, the Director-General of the European Anti-Fraud Office and the Director of the Authority for European Political Parties and European Political Foundations are appointed jointly by the European Council, the European Parliament and the European Commission. In these cases, it is not easy to know whether the decision-making process truly gives an equal say to all institutions involved and, if not, where the real decision is made.
Agencies of the European Union
There are too many agencies to cover them all in detail. Broadly speaking, and from the point of view of the appointment of their top leadership, there are three main categories for EU agencies.
The first one is made up of the European Commission’s executive agencies. As the name suggests, these agencies are squarely under the authority of the European Commission which is responsible for the appointment of their (Executive) Directors.
The second group is the most common and sees the Board (or one or more of the Boards) of the agency appoint the Head of the agency. A short review of agencies’ legal bases shows a trend towards the harmonisation of agencies’ internal structure as well as of the nomination process of their top leadership. Most recently created or recently amended Regulations describing agencies now confer upon the European Commission the duty to provide a shortlist of candidates, and on voting members of a Board (often called the “Management Board”) the right to select their preferred candidate.
A last category is made up of special cases or agencies that have not yet been reformed to fit under the above second category — although it remains unclear whether such plans for reform exist. Examples include the Chief Executive of the European Defence Agency, nominated by the European External Action Service, or the President of the Community Plant Variety Office, nominated by the Council of the European Union.
Link: https://public.tableau.com/app/profile/eudemocracy/viz/GRELO2024/Latestyears-bynominatingbody
Key figures
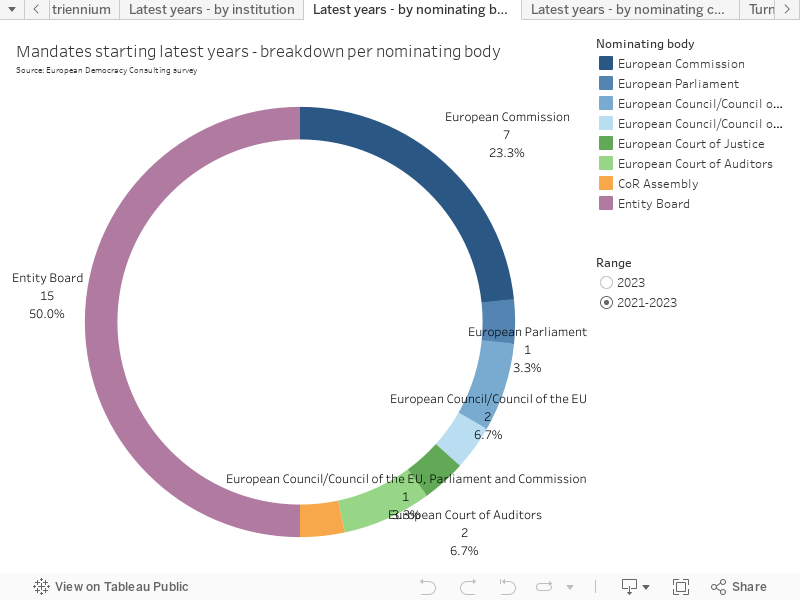
- Over the 2021-2023 triennium, entity boards were responsible for close to half of all appointments, the European Commission for under a quarter, and European Council/Council for under 7%. For 2023 alone, the European Council/Council’s share increases to 14%.
Appointment by category
The above information provides an overview of which body or group appoints the office-holders recorded by GRELO. However, in many instances, the ultimate decision-makers may not appear clearly, especially to citizens unfamiliar with European institutions. It is therefore useful, for transparency purposes, to re-arrange the nominating bodies identified according to their own members.
An easy example is that of the European Council and Council of the European Union. When we say that the “top jobs”, among many others, are appointed by the European Council, we are actually saying that the Heads of States or governments of Member States are responsible.
More about the various nominating entities
- European Council and Council of the European Union. The European Council is made up of Heads of States or governments of the Member States. The Council of the European Union is made of the ministers of Member States, gathering in thematic configurations.
- European Commission. Assuming that the appointment of the EU’s top leadership is under the ultimate responsibility of the President of the European Commission, these appointments are made by an EU civil servant politically appointed by the Member States.
- European Parliament. The European Parliament of composed of EU representatives directly elected by citizens.
- Court of Justice of the European Union. The Court of Justice is made up of legal experts appointed by their respective Member State governments.
- European Court of Auditors. The Court of Auditors is made up of legal experts appointed by their respective Member State governments.
- European External Action Service. Assuming that the appointment of the EU’s top leadership is under the ultimate responsibility of the High Representative, these appointments are made by an EU civil servant politically appointed by the Member States.
- European Economic and Social Committee Plenary. Members of the EESC Plenary are EU representatives nominated by their respective Member State governments and appointed by the Council of the European Union, itself composed of government ministers. Members of the EESC Plenary elect the EESC Bureau.
- Committee of the Regions Assembly. Members of the CoR Assembly are EU representatives nominated by their respective Member State governments and appointed by the Council of the European Union, itself composed of government ministers.
- Entity Board. As we have indicated, there is a wide array of configurations for entity boards, making a strict categorisation impossible. However, the large majority of entity boards tasked with leadership appointments (whether EU agencies, the European Institute of Innovation and Technology, the European Investment Bank, the European Investment Fund, or the European University Institute) comprise, among their voting members, representatives of Member States government or of national institutions, which form the majority of the board’s votes. Additionally, boards often include one or more representatives of the European Commission, as well as, for instance, representatives of the European Parliament (ACER, EMA), Council (ACER), workers’ and employers’ organisations (CEDEFOP, EU-OSHA, Eurofound), or UNHCR (EUAA).
In line with the EU’s nation-centric structure, most of the nominating bodies can be traced back to national governments, either through Heads of State or government, ministers, government representatives, national heads of specialised institutions, or EU representatives, civil servants or experts appointed by Member States. In fact, the only nominating body arguably not linking back to national governments is the European Parliament — made up of EU representatives directly elected by European citizens.
Of course, we are not arguing that all those with ties to a national government are considered mouthpieces of their Member State. For instance, experts appointed by Member States, such as judges on the Court of Justice or auditors on the European Court of Auditors, are likely to be less sensitive to national executives’ desiderata. The same, however, cannot be said of Member State representatives on agency boards or of more political appointments, such as the “top jobs” or for local elected officials appointed to the Committee of the Regions.
This re-arrangement better displays those responsible for the appointment of the EU’s leadership and, therefore, where the impetus must come from for the improvement of geographical representation.
Link: https://public.tableau.com/app/profile/eudemocracy/viz/GRELO2024/Latestyears-bynominatingcategory
Key figures
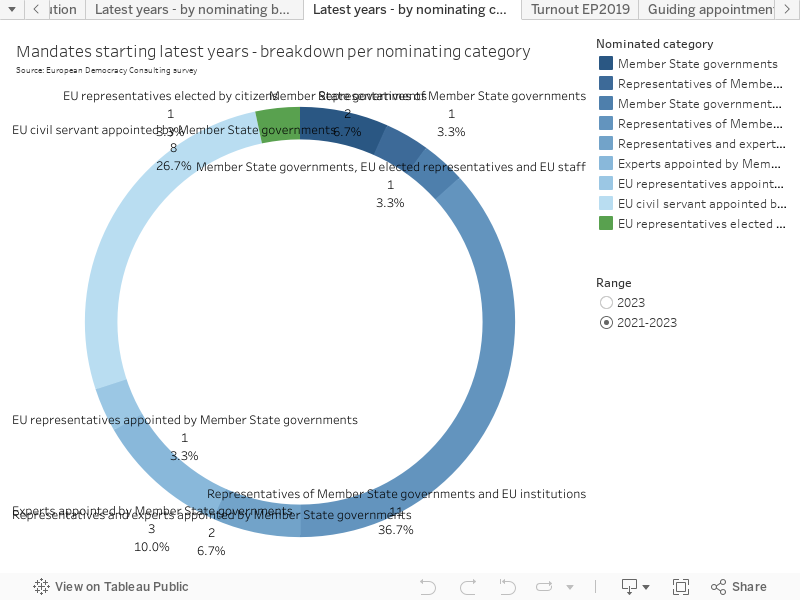
- While Member States, via the European Council or Council of the European Union, were only directly in charge of under 7% of appointments, Member State governments, their representatives and appointees were involved in 67% of all appointments over the triennium.
- Over the same period, EU representatives and civil servants appointed by Member State governments were responsible for another 30% of appointments.
- Meanwhile, EU representatives directly elected by citizens were responsible for only 3% of appointments.
Recommendations
Remedial measures must be considered by a range of actors, but first and foremost — as we have seen above — by Member State governments and their representatives and appointees in EU entities.
Following an in-depth discussion across the EU, the Council and the Commission should adopt a joint commitment declaration with clear action points. Understandably, given the sensitivity and political nature of this issue, it may be easier to agree on broad objectives rather than on concrete figures.
Here are necessary acknowledgements and actionable recommendations for action that should feature in this declaration. Unfortunately, given the Council and Commission’s lack of response and action following previous editions of the Observatory, our recommendations remain largely the same as in previous years.
1. Acknowledge the lack of proper geographical representation in the EU’s leadership
The first step in addressing under-representation is to acknowledge its existence. This Observatory lists ample and verifiable data highlighting the severe lack of representation of Central and Eastern European citizens in EU leadership positions, especially at the highest levels.
The Council and Commission may decide that appointments ought to be made solely based on competence, and that the observed lack of geographical representation is a consequence of this policy. However, with Central and Eastern Europe representing 40% of Member States and 20% of the EU’s population, their almost complete and continued absence from EU leadership positions becomes indefensible. The Council and Commission should use these results and acknowledge the imbalances identified.
2. Acknowledge the likely negative impact of this lack of proper geographical representation
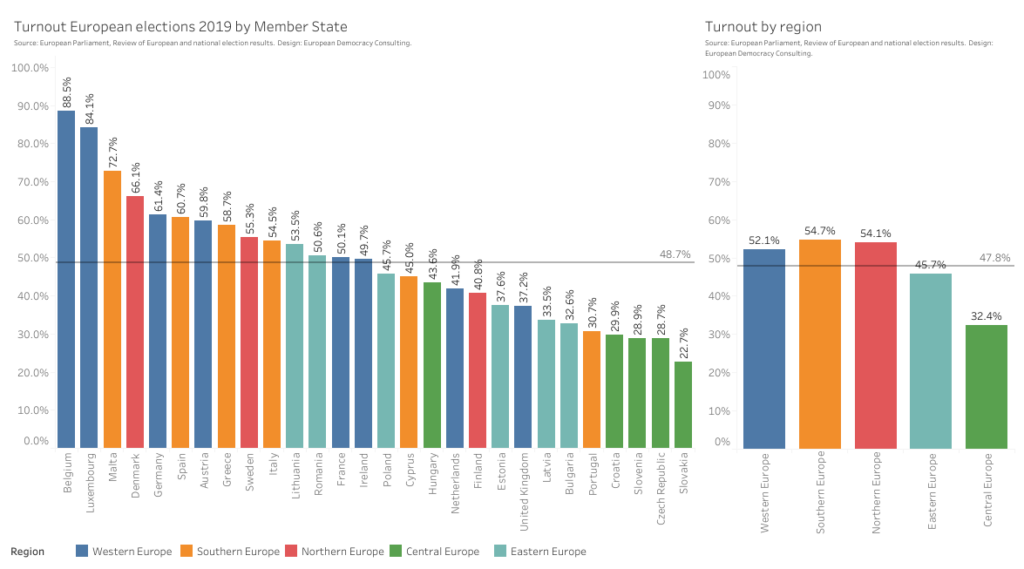
Several countries in Central and Eastern Europe — first and foremost, Hungary and Poland — have given rise to illiberal-minded governments which have repeatedly acted to undermine the rule of law, a treaty-enshrined value of the European Union.8 The limited participation of these regions in European elections should also be a concern: in 2019, nine out of eleven countries from Central and Eastern Europe were under the EU’s average turnout (compared to only five out of 17 for the remaining regions), and four out of five Central European countries were the four least-voting countries in the EU, with rates ranging from 30 down to less than 23%. At the regional level, Central and Eastern Europe also have a noticeably lower turnout than the other three. While there are surely a number of other factors at play, it is clear that the absence of citizens of these countries from leadership positions is sure to further alienate their citizens from the Union.
In this light, it is particularly disappointing that previous GRELO editions mostly found an echo in Hungarian and Polish pro-government publications or supporters social media, while pro-European officials remained quiet.
3. Acknowledge the Council and Commission’s central role in appointments and, therefore, in the improvement of geographical representation
Last but not least, Member States, by virtue of the European treaties and of EU entities’ statutes, must acknowledge their direct and primary position in the filling of leadership positions and, therefore, their inescapable role in addressing and remedying the lack of proper geographical representation in the EU’s leadership.
4. Establish dimensions of analysis and baseline measures
In order to start addressing the identified lack of representation, the Council and Commission need to know from where they start. They must first identify the dimensions along which the level of proper representation will be assessed. The Observatory highlights a number of measures that can be used: overall representation since the EU’s founding (objectively the least useful dimension), representation since a specific date, representation proportionally to regions’ number of Member States or population, and representation following a number of years of membership. All these dimensions were considered from the perspective of appointments and mandate durations, and broken down by groups of institutions. They can be re-used for the Council and Commission’s analysis.
However, the survey focuses only on successful elections and appointments, and baseline measures must go beyond publicly available data. In addition, the Council and Commission must look at steps ahead of elections and appointments. In the case of elections, the number of candidates from each region and their rate of success. In the case of appointments, and depending on the precise mechanism, the number of candidates from each region considered for a short list, the number of candidates from each region making it to the short list, and their eventual rate of success.
Going one step further, the Council and Commission must consider the current representation of each region among EU civil servants — disaggregated not only by institution, but also by position level — which forms a large pool for non-political appointments. This should cover both career civil servants and contractual staff members.
5. Establish goals and targets
Once these various dimensions and measures have been established, the Council and Commission must agree on their objectives, including a clear long-term goal and one or more time-bound intermediary goals.
As indicated earlier, European Democracy Consulting does not support or promote the strict equality of representation for Member States or regions, as this would put an unwelcome constraint on hires, which ought to remain guided first and foremost by individual competence. Instead, the Council and Commission should commit to a set of flexible targets. For instance, “by 2030, over a running three-year period, each region’s share of appointments pro rata of its population should range between 15 and 25%” (all regions receiving 20% would mean strict equality).
Similar goals must be divised for dimensions not surveyed by the Observatory and presented in the points above. All of these should be further refined by institution type, and be given intermediary goals over the next decade.
6. Define actions
Once goals have been set, the Council and Commission must delineate the specific actions they will take to achieve them.
Ensuring transparency is a precondition for action. While most EU entities already disclose information on their current executive leadership, information on previous leaders is limited, and often times scarce or entirely missing on the details of the selection process. This should be remedied to as part of good governance measures on transparency. While information on short-listed or competing candidates needs not be publicly available, related statistics should be collected in a relevant yearly publication.
Beyond transparency, affirmative action policies are the most obvious proposal and are already used to address other instances of under-representation. In 1997, the Inter-Parliamentary Union (of which all European national parliaments are members, in addition to the European Parliament as an associate member) indicated in its “Plan of Action” on gender representation that “on a strictly interim basis, affirmative action measures may be taken. Wherever the measure chosen is a quota system, it is proposed that the quota should not target women, but that, in the spirit of equity, it may be established that neither sex may occupy a proportion of seats inferior to a given percentage.”
While affirmative action may be politically divisive, the Charter of Fundamental Rights of the European Union already states that “the principle of equality shall not prevent the maintenance or adoption of measures providing for specific advantages in favour of the under-represented sex” (Article 23).
EU institutions have also repeatedly supported measures of this nature. In 2012, the European Parliament welcomed parity systems and gender quotas introduced in some Member States and urged others to consider legislating to facilitate gender balance in political decision-making.9 In 2015, the Council called upon the Commission, governments, political parties and the European and national parliaments to promote a gender-balanced representation — for example by introducing gender-alternate lists, which the European Parliament has since supported.10 Finally, the Commission’s Gender Equality Strategy 2020-2025 includes equality between women and men in decision-making as a priority objective, setting out soft law measures — including data-collection. In 2012, the Commission proposed a Directive, since agreed to by the European Parliament and the Council, setting a target for EU companies listed on the EU stock exchanges to accelerate the reach of better gender balance; the Directive sets a share of 40% of the underrepresented sex among non-executive directors and 33% among all directors.
Similar temporary measures may be taken to ensure proper geographical representation in the EU’s leadership. For instance, “by 2030, over a running three-year period, each region should not receive a number of appointments one-third below or above its population share, with a maximum spread of 10 points”, as shown in our three-year analysis.
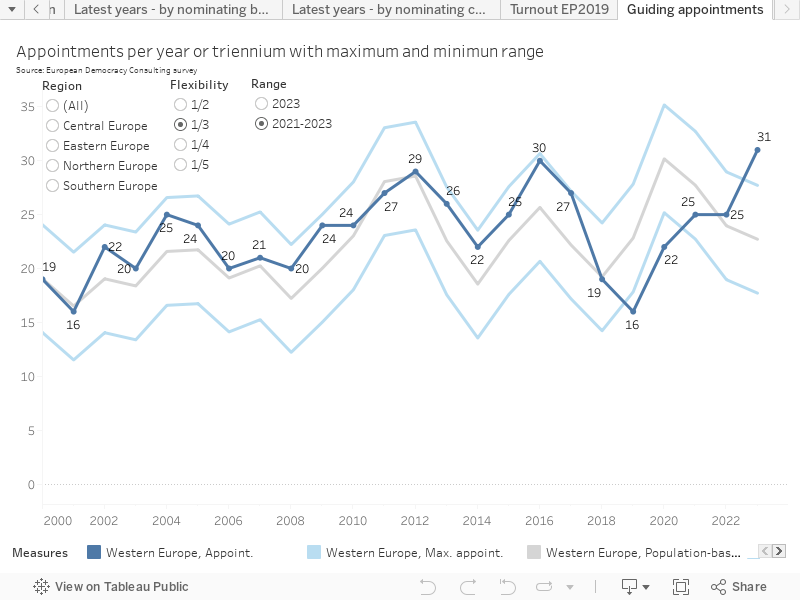
Link: https://public.tableau.com/app/profile/eudemocracy/viz/GRELO2024/Guidingappointments
Key figures
- Since the 2002-2004 triennium, Southern and Northern European citizens have almost consistently received more appointments than their population-based quota; the latter often outpacing the proposed flexibility range.
- Likewise, apart from a lull in recent years, Western Europe has also consistently fared better than its population-based quota, and, despite the continued over-representation of its citizens, has steadily improved its representation over the past trienniums and now exceeded its flexibility range.
- With some recent exceptions, Central and Eastern Europe have consistently received fewer appointments than their population-based quota, and are often well below their flexibility range.
Of course, numbers alone do not fully do justice to proper representation, as different entities have different levels of prestige and public visibility. As such, increasing the number of Central and Eastern Europeans in leadership positions is important, but it is likely to fall short of true proper representation if appointments only concern EU agencies while all top job positions are attributed to Western and Southern Europeans.
In addition to quotas, which focus exclusively on the outcome of the selection process, other measures must be adopted upstream. This includes the overall promotion of diversity among the EU’s public administration. This representation cannot simply be measured as an aggregate, but be ensured across all hierarchical levels, including the ones leading to consideration for leadership positions.
In its 2009 report on Fostering Diversity in the Public Service, the OECD describes diversity “not only as the mixture of backgrounds and competences but also as valuing and using people’s competences, experience, and perspectives to improve government efficiency and effectiveness, and to meet public servants professional expectations.” It highlights a “growing consensus […] that pursuing diversity may also help to preserve core public service values such as fairness, transparency, impartiality and representativeness.” The report notes “a growing tendency to see diversity as an asset rather than as a problem” and encourages governments to include diversity principles “part of any public management reform, as diversity initiatives cannot succeed as an isolated strategy.”
In particular, measures should be considered to “make the recruitment process fairer, more transparent and more flexible to attract talented people with a mix of backgrounds, experience and perspectives. Improvements to the recruitment process refer to the instruments or mechanisms that aim to: i) diversify the communication channels to reach a wider audience; ii) motivate people to apply for vacancies in the public service; iii) relax the selection process and criteria to make them more inclusive but still focused on analysing skills, qualities and competencies required for the job; and iv) facilitate the integration and retention of new recruits to the workplace.”
In a 2019 survey on Managing a diverse public administration or effectively responding to the needs of a more diverse workforce, the OECD further encourages governments to go “beyond technical efficiency to the creation of public value where the civil service aims to deliver better services to all and strengthen the legitimacy of, and confidence in, public sector institutions in the eyes of the public. It suggests the need to design more diverse and inclusive policies and services, supported by more diverse and inclusive public sector institutions. A representative public sector workforce also sends a strong message of inclusion, that public sector institutions are serious about taking all of their citizens’ concerns to heart and designing policies and programs that meet their needs.”
Beyond the Council and Commission, these measures highlight the special role to be played by the European Personnel Selection Office (EPSO), as the office responsible for selecting staff for all institutions, bodies and agencies of the European Union, and the European School of Administration (EUSA), which organises training programmes for staff of EU institutions, bodies and agencies.
7. Track progress publicly
Finally, once actions have been decided, progress along the dimensions identified earlier must be periodically assessed and made public, at least on a yearly basis. If need be, the dimensions themselves may be reviewed and improved in order to better track the impact of the actions taken, and actions should be amended as necessary to ensure long-term objectives are met.
Public scrutiny and clear lines of responsibility, in particular of the Council and Commission, must be guaranteed to ensure that the relevant actors are held accountable. We aim for this Geographical Representation in EU Leadership Observatory to be a significant and useful first step in this direction.
8. act and do not leave the results of this analysis to Eurosceptic movements
As indicated above, previous GRELO editions mostly found an echo in Hungarian and Polish pro-government publications or supporters social media. Following the publication of the initial GRELO, two questions were addressed by Members of the European Parliament to the European Commission, asking what the Commission planned on doing to address the geographical imbalances identified by our Observatory; both questions stemmed from members the hard-right European Conservatives and Reformists Group, from the Polish Law and Justice (PiS) party.11 All the while, and despite some media coverage, pro-European officials remained quiet on the topic.
While we understand how social media provides an easy and, very often, disproportional echo chamber for nationalist groups, and while we do not expect our research to make major headlines, it is not encouraging to see such a one-sided re-use of our data.
Contacted directly and provided with the results of our study, major European institutions were either silent or issued generic responses restating their commitment to diversity. Given the eagerness of nationalist movements to capitalise on this data to disparage the EU, we can only encourage European institutions and leaders to more actively seize themselves of this topic and actively seek to address the disparities identified for the benefit of all European citizens.
About European Democracy Consulting
European Democracy Consulting is a consulting firm specialising on the provision of legal and political expertise on institutional and constitutional matters. Our goal is the strengthening of European democracy through reform and the application of best-practice measures.
OUR HISTORY
European Democracy Consulting was created in 2019, out of the desire to improve our European democracy. The 2019 European elections have shown a renewed interest for our Union, but also the limits of citizens’ engagement. Following these elections, European Democracy Consulting was set up to help decision-makers, public institutions, and NGOs in their promotion of a more democratic, transparent and efficient European Union.
OUR VISION
Democracy does not always come easy; there may be vested interests opposing its development. As a result, sixty years after its creation, the European Union still falls far short of the democratic standards of developed countries.
We wish to bring our solid expertise to support a value-based discussion and propose concrete political and legal solutions, based on best-practices, that will strengthen our common democracy for the general interest of all Europeans.
- https://european-union.europa.eu/institutions-law-budget/institutions-and-bodies/types-institutions-and-bodies_en
- The European Central Bank is a particular case, in that its composition is the Eurozone and not the full European Union — leaving aside Bulgaria, the Czech Republic, Denmark, Hungary, Poland, Romania, and Sweden. Using our classification, Central and Eastern European countries belonging to the Eurozone are: Estonia, Croatia, Latvia, Lithuania, Slovakia, and Slovenia.
- The Fusion for Energy Joint Undertaking (F4E) was included in GRELO as one of the only two bodies, alongside the EURATOM Supply Agency, set up under the EURATOM treaty. Conversely, the Computer Emergency Response Team (CERT-EU) was not included, despite its inter-institutional nature, as it is an administrative unit of the European Commission’s Directorate-General for Informatics.
- In the same way as we had handled previous institutional changes (such as with the European Parliament, initially set up as the Common Assembly of the European Coal and Steel Community in 1952), and in an effort to be true to the organisational nature of EU entities, we assigned all previous office-holders to the new name when the new agency is a clear successor to a previous one, and created a new entry where the new agency is markedly different from its predecessor(s). For instance, all directors of the GSA and of the INEA are now recorded as having been directors, respectively, of the EUSPA and of the CINEA, even though these agencies bore a different name under their tenure. However, given the heavy restructuring involved, HaDEA is considered a separate entity from the now-defunct CHAFEA.
- https://www.consilium.europa.eu/en/press/press-releases/2023/12/13/anti-money-laundering-council-and-parliament-agree-to-create-new-authority/
- https://www.politico.eu/article/frankfurt-to-host-eu-dirty-money-watchdog-amla/
- As for all other data, the point of reference is the office-holder’s first day in office, and not the day the appointment was decided. We also include interim office-holders: if an interim (or “acting”) office-holder is later confirmed in their position, only one appointment is counted and their mandate is considered to have begun when they started in their interim role; if they are replaced with another office-holder, two appointments are counted.
- Treaty on European Union, Article 2: “The Union is founded on the values of respect for human dignity, freedom, democracy, equality, the rule of law and respect for human rights, including the rights of persons belonging to minorities. These values are common to the Member States in a society in which pluralism, non-discrimination, tolerance, justice, solidarity and equality between women and men prevail.”
- European Parliamentary Research Service, Women in politics in the EU State of play, 2019, https://www.europarl.europa.eu/RegData/etudes/BRIE/2019/635548/EPRS_BRI(2019)635548_EN.pdf
- European Parliament, Legislative resolution of 3 May 2022 on the proposal for a Council Regulation on the election of the members of the European Parliament by direct universal suffrage, 2022, https://www.europarl.europa.eu/doceo/document/TA-9-2022-0129_EN.html
- https://www.europarl.europa.eu/doceo/document/E-9-2021-000467_EN.html and https://www.europarl.europa.eu/doceo/document/E-9-2021-000829_EN.html
Pingback: As Ukraine's civilian death toll rises, Zelensky accuses allies of 'turning a blind eye'
Pingback: L’Europe se lève à l’est : le billet de Francis Brochet – EE24
Pingback: Submission, Defiance, and Emancipation? Two Decades of the EU’s Eastern Periphery - Lefteast
Pingback: Přijetí eura neznamená lepší pozici u vyjednávacího stolu v rámci EU či eurozóny, ani silnější negociační kartu, všímá si agentura Bloomberg | Lukáš Kovanda