Update: the 2023 edition of the EU-GRLO is available here, and the 2022 edition is available here.
In November 2019, European Democracy Consulting carried out a quick review of geographical representation in the EU’s leadership. Looking at the distribution of EU agencies and the nationality of key office-holders, this review highlighted a worrisome pattern of under-representation for Central and Eastern Europe, as well as the continued predominance of Western and Southern Europe.
Today, following an extensive survey, we are proud to launch our new Geographical Representation in EU Leadership Observatory 2021. This Observatory aims at providing an in-depth understanding of the geographical composition of the EU’s leadership through a complete and annually updated dataset of executive office-holders. While we hope to progressively see trends evolve, the Observatory’s baseline analysis already confirms the 2019 findings of profound discrepancies in geographical representation to the detriment of Central and Eastern Europe.
We wish to warmly thank all the EU institutions, bodies and agencies that have cooperated with this survey by providing information on their leadership in a timely manner. Their support and commitment to transparency is much appreciated. Of course, we welcome corrections for any identified error in our dataset.1
This report can be found here in PDF format.
© 2021 European Democracy Consulting
First edition published in January 2021.
European Democracy Consulting publications are independent of specific national or political interests. They are based on objective facts and data and reflect our analysis. The Geographical Representation in EU Leadership Observatory is pro bono work and was not commissioned by any third-party.

The Geographical Representation in EU Leadership Observatory 2021 and its related dataset by European Democracy Consulting are licensed under a Creative Commons Attribution-NonCommercial-ShareAlike 4.0 International License.
You are free to copy, distribute and transmit the publication as well as to remix and adapt it, provided it is only for non-commercial purposes, that you appropriately attribute the publication (European Democracy Consulting, https://eudemocracy.eu/geographical-representation-eu-leadership-observatory), and that you distribute it under an identical licence.
For more information on this licence visit the Creative Commons website: http://creativecommons.org/licenses/by-nc-sa/4.0/
European Democracy Consulting
Telephone: +33(0)7.81.03.32.87
Email: contact@eudemocracy.eu
Website: https://eudemocracy.eu/
Data and design: European Democracy Consulting
#0B5CBF;">AbstractThis report analyses the level of geographical representation among the European Union’s leadership from two complementary perspectives: the number of leadership appointments received by each region and the cumulated mandate duration of office-holders stemming from these regions. The regions are Western, Southern, Northern, Eastern and Central Europe, and the positions concerned are the executive leaders of the EU’s institutions, advisory bodies, agencies and other bodies. The survey covers 72 EU entities, 89 positions, and close to 500 office-holders from 1952 to 2020. KEY WORDS geographical representation; regional representation; leadership; East-West divide; European Union; European institutions. |
#0B5CBF;">Key figures and survey conclusionsNote: whether based on regional equality, on regions’ number of Member States, or on their population, for each of the five regions considered to achieve equal representation means for each to reach a 20% “equality mark”.
|
#0B5CBF;">Recommendations
|
Table of Contents
Observing leadership geographical representation in the EU
European Democracy Consulting’s 2019 review of geographical representation in the EU’s leadership, and on the related “East-West divide”, focused on two main elements: the location of EU institutions, bodies and agencies, and the nationality of their senior leadership.
Given the rather fixed nature of institutions’ physical location, there is little need for an annual review:

Source: AGERPRES/Ionutzmovie (YouTube CC-BY)
- Institutions and advisory bodies are listed in EU treaties, and therefore none has been created since 2009 at the latest;
- The most recently created independent body, the European Public Prosecutor’s Office, set up in 2020, is to be located in Luxembourg;
- The most recently created agency, the European Labour Authority — formally set up in 2019, although it still does not have a Director — was already accounted for in our review of last year; and,
- Ahead of Brexit, the European Medicines Agency and European Banking Authority moved their headquarters from London to Amsterdam and Paris, respectively.
None of these element contributes to improving the representation of the “East” part of the EU. The imbalance in representation identified last year therefore remains and cannot be expected to change in any meaningful way over the coming years.
By contrast, the nationality of EU entities’ senior leadership is much more fluid: it is periodically reviewed and can, in theory and with the proper political will, be led to provide for better geographical representation. Our Observatory therefore tracks the evolution of appointments and mandate durations for each of the EU’s regions.
However, while last year’s review focused solely on the EU’s top jobs (the presidents of the Commission, Parliament, Council, and Central Bank) and a few other lead positions for major institutions between 2004 and 2019, this Observatory is expanding its analysis to all EU institutions, bodies and agencies, from their inception to the present day. As a result, our Geographical Representation in EU Leadership Observatory surveys 72 entities, 89 positions, and close to 500 office-holders from 1952 to 2020.
The goal of this Observatory is to analyse the state of play and long-term trends of the representation of the EU’s regions among senior leadership positions. As a result of the survey conducted, the main conclusion of this Observatory is a continued lack of representation of citizens from Central and Eastern Europe in the EU’s leadership.
Considerations on representation and legitimacy
As noted in 2019, the first and foremost criteria for the appointment of leadership positions must be and remain individual competence (whether it is called merit, expertise, experience, etc.). Of course, ideology is another important element in the case of political positions.
In political systems with clearly distinguishable demographic groups, differences in levels of representation may be understandable for numerically insignificant groups, and European Democracy Consulting does not advocate for the exact representation of every sub-group of society. However, a lack of representation becomes indefensible when the group in question represents close to 40% of Member States and 20% of the EU’s total population.
Despite the creation of a common European citizenship through the Maastricht Treaty in 1992, national identities remain a strong identification factor in the European Union, and citizens overwhelmingly continue to associate with their co-nationals. As a result, the continued under-representation — let alone the almost complete lack of representation — or even just a feeling of lasting under-representation of one or several Member States is not to be taken lightly, as it is sure to lead to frustration and could severely undermine support for the EU’s institutions, values and policies, and decrease adherence to political decisions.1 This impact on the general population may eventually affect the behaviour and “europeanness” of national leaders, which in turn would impact EU governance and cohesion.
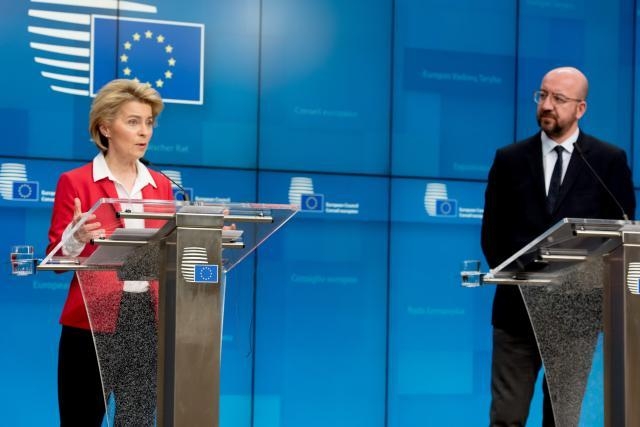
Rarely was this lack of geographical representation more visible than in July 2019 when, following the European elections, the European Council announced its four candidates for the EU’s top jobs. The Council nominated Ursula von der Leyen of Germany as President of the Commission, Josep Borrell of Spain as High Representative, and Christine Lagarde of France as President of the European Central Bank, and elected Charles Michel of Belgium as President of the European Council; three candidates from Western Europe and one from Southern Europe.2 The only non-Western or Southern nomination was the suggestion of former Bulgarian Prime Minister Sergei Stanishev as President of the European Parliament — the one position that the European Council does not have the power to influence. David Sassoli of Italy was soon elected President by the European Parliament, closing the door to all other regions for the EU’s most prestigious and public positions.
Noting the rise of Eurosceptic feelings and illiberal policies in Central and Eastern Europe, it is most useful and timely to have a look at the sociology of European leaders, with a particular focus on their national citizenship, so as to address imbalances that may further alienate certain Member States’ citizens.
Presentation of the data
Regions
For the purpose of this geographical representation observatory, the European Union is divided into five regions. This choice is based on geographical, but also historical, cultural and economic criteria. Following the publication of the 2019 review, this division led to disagreements, mostly over the distinction between Central and Eastern Europe. As the data shows, our conclusions are largely similar for these two regions, making their precise contours less relevant. A simpler East-West division could have gathered our Western, Southern and Northern countries as “the West” and the Central and Eastern European ones as “the East”, but the adopted division is more precise.
Another source of disagreement was the inclusion of the three Baltic States in Eastern Europe, instead of Northern Europe. Discussions regarding the definition of Eastern Europe are plentiful, and the Baltic States move in and out depending on the focus of the conversation. In this case, the Observatory does not focus exclusively on cultural or linguistic aspects (the majority of people in Latvia and Lithuania are Baltic, the majority in Estonia are Finnic), but also on levels of development, including GDP and HDI, where the Baltic States are much closer to the rest of Eastern Europe than to Sweden or Finland. The three countries also share a common communist past with much of Eastern and Central Europe and, from an accession perspective, joined the EU via the 2004 enlargement, alongside most of Central and Eastern Europe, and much later than the Nordic countries. For similar reasons, Austria is included in Western Europe.
Link: https://public.tableau.com/profile/eudemocracy#!/vizhome/GeographicalRepresentationinEULeadershipObservatory2021/MapofRegions
Given the time period considered, the United Kingdom is included as a Member of the European Union. By and large, Brexit does not impact our analysis.
#0B5CBF;">Key figures
|
Institutions, bodies and agencies
In order to be inclusive and thorough, the scope of our study was broadened to virtually all institutions, bodies and agencies of the EU. Our resulting classification comprises 72 entities.
Depending on the source of information (commission website, EU Who is Who, etc.), these entities are grouped in varying categories. For the purpose of this Observatory, the precise differences, especially among agencies, matter little. For ease of understanding, the Observatory relies on the following four categories:
- Institutions of the European Union: the seven entities listed in Article 13.1 of the Treaty on European Union. This category also includes two legacy institutions, the Commission of the European Atomic Energy Community and the High Authority of the European Coal and Steel Community, although their impact on the data is marginal.
- Advisory bodies to the European Union: three entities created by the European treaties but lying outside of the main institutional framework (Articles 13.4 TEU and 38 TEU). They have no legislative or decision-making power, and their main role is to advise EU institutions. One of them, the Political and Security Committee, is headed by the High Representative of the European External Action Service; given its composite structure, the EEAS and the HR/VP are placed in this category.
- Agencies of the European Union: the 47 EU agencies form a diverse group of decentralised bodies established for specific tasks and endowed with their own legal personality. Their fields of work are extremely diverse, ranging from law enforcement, to health, transportation, etc. EURATOM agencies are included, but not Joint Undertakings (public-private partnerships set up under the Horizon 2020 programme). One of them, the European Agency for Reconstruction, was terminated in 2008.
- Other EU bodies: finally, the EU has set up thirteen other independent bodies for specific purposes, which are best placed together in a common category despite their unique characteristics.
| Institution of the European Union | ||
| European Commission | European Parliament | European Council |
| Council of the European Union | European Central Bank | European Court of Justice |
| European Court of Auditors | European Atomic Energy Community | High Authority of the European Coal and Steel Community |
| Advisory bodies to the European Union | ||
| European Economic and Social Committee | Committee of the Regions | European External Action Service |
| Other EU bodies | ||
| European Investment Bank | European Investment Fund | European Ombudsman’s Office |
| European Data Protection Supervisor’s Office | European Public Prosecutor’s Office | European University Institute |
| Publications Office of the European Union | European Personnel Selection Office | European School of Administration |
| European Anti-Fraud Office | Authority for European Political Parties and European Political Foundations | European Institute of Innovation and Technology |
| European Research Council | ||
| Agencies of the European Union | ||
| European Union Agency for the Cooperation of Energy Regulators | Body of European Regulators of Electronic Communications | Translation Centre for the Bodies of the European Union |
| European Centre for the Development of Vocational Training | European Union Agency for Law Enforcement Training | Consumers, Health, Agriculture and Food Executive Agency |
| Community Plant Variety Office | Education, Audiovisual and Culture Executive Agency | European Union Aviation Safety Agency |
| Executive Agency for Small and Medium-sized Enterprises | European Asylum Support Office | European Banking Authority |
| European Chemicals Agency | European Centre for Disease Prevention and Control | European Defence Agency |
| European Environment Agency | European Fisheries Control Agency | European Food Safety Authority |
| European Institute for Gender Equality | European Insurance and Occupational Pensions Authority | European Institute for Security Studies |
| European Labour Authority | European Medicines Agency | European Monitoring Centre for Drugs and Drug Addiction |
| European Maritime Safety Agency | European Union Agency for Cybersecurity | European Union Agency for Railways |
| European Research Council | Euratom Supply Agency | European Securities and Markets Authority |
| European Systemic Risk Board | European Training Foundation | European Union Satellite Centre |
| European Agency for the operational management of large-scale IT Systems | European Agency for Safety and Health at Work | European Union Intellectual Property Office |
| European Foundation for the Improvement of Living and Working Conditions | European Body for the Enhancement of Judicial Co-operation | European Union Agency for Law Enforcement Cooperation |
| European Joint Undertaking for ITER and the Development of Fusion Energy | European Union Agency for Fundamental Rights | European Border and Coast Guard Agency |
| European GNSS Agency | Innovation and Networks Executive Agency | Research Executive Agency |
| Single Resolution Board | European Agency for Reconstruction | |
Cells greyed out indicated former entities. For clarity purposes, entities changing their name
or status were grouped together with their successor entities; see footnote for more information.3
Positions
For most entities, the survey focuses on the executive leader; where relevant, however, it also includes secondary positions. Overall, the survey covers 89 distinct positions.
- Institutions of the European Union: For these entities, the survey focuses on the President, who is often a public figure, in particular for those part of the so-called “top jobs”.4 Since the Council of the European Union carries a rotating presidency, its top leadership is not included in this study — likewise, the presidency of the European Council is only recorded from the moment it became a fixed appointment.
The survey also covers the positions of Secretary-General for the European Commission, European Parliament and for the Council of the European Union, which all enjoy a wide influence on these institutions. In the case of the Central Bank, the record includes the Vice President and the four other members of the Executive Board. For the Court of Justice and Court of Auditors, the survey adds, respectively, the Vice President and Registrar, and the Secretary-General. - Advisory bodies to the European Union: For these entities, the survey covers the positions of President (and HR/VP, as relevant) and Secretary-General.
- Agencies of the European Union: For agencies, the survey focuses on the top executive position, almost always called Director or Executive Director. A few agencies also have a President, but their roles vary and, for the sake of uniformity, they are not included.
- Other EU bodies: For these entities, the survey mostly centres on the top executive position, with the exceptions of the European Investment Bank, European Investment Fund, and European University Institute. Names vary widely depending on the entity, ranging from the classic Director, to names reflecting the Office in question, such as European Ombudsman, European Data Protection Supervisor, or European Public Prosecutor.
Mandates
As a result of the entities and positions reviewed, our survey has collected information on 481 mandate-holders, ranging from 1952 to the present day: 84 are incumbents, and 396 have completed their mandates. Here are a few comments on the methodology:
- Given the importance of experience and, therefore, the high comparative advantage of an incumbent facing re-nomination vis-a-vis other candidates, a re-nomination is not counted as a separate appointment. This was made in order to focus on instances when a new candidate was actively chosen for a position.
- Given that their tenure is often rather long, acting executives are counted alongside regular ones. This was made as it informs on the nationality of deputies and often covers long durations. In line with the previous point, where applicable, the appointment of an Acting Director and its confirmation to full Director status are counted together.
For each of the institutions and positions concerned, the analysis focuses on the number of appointments and on the mandate durations (counted in number of days), broken down by region. This allows us to account both for the number of appointments that each country or region receives for its citizens, as well as the amount of time each region’s citizens has occupied each office.
Observatory data and analysis
Timeline of office-holders
Before diving into the comparative analysis of the Observatory’s data, here is an overview of the information collected. This timeline displays all office-holders, for each category and entity. The name, nationality, and mandate start and end dates are further indicated upon hovering over the timeline.
Colour-coded per region, the timeline gives a first sense of the preponderance of office-holders from Western and Southern Europe (blue and orange), and, to a lesser degree, from Northern Europe (red).
Link: https://public.tableau.com/profile/eudemocracy#!/vizhome/GeographicalRepresentationinEULeadershipObservatory2021/TimelineofEUleadership
Scroll down to see all surveyed EU entities and positions.
Overall figures and first trends
A first, rough analysis of the data considers all positions since the beginning of the European project. While the exact number of days is not relevant, the graph confirms the strong domination of Western European countries, with almost two-thirds of cumulated mandate durations (65.0%) and number of appointments (61.5%). Southern European countries receive around a quarter on both counts (23.5% and 26.7%, respectively), while Northern European Countries get under a tenth (7.6% and 6.9%). Eastern and Central European countries are seldom represented, with respectively 2.7 and 2.3% of the number of appointments and 1.9 and 2.0% of cumulated mandate durations.
As a reminder, for this as for all following visualisations using percentages, since the Observatory considers five regions, equal representation means that each region would receive around 20%.
#0B5CBF;">Key figures
|
Breakdown by type of entity
The breakdown of these mandates and appointments by type of entity is even more illuminating. For instance, it shows that leadership positions of EU institutions — gathering only 9 of the 72 entities surveyed, but the most prestigious ones — account for around 30% of total appointments and over a third of cumulated mandate durations for Western and Southern Europe. Other prominent positions (in the Advisory bodies and Other bodies categories) also account for around a third of appointments.
By contrast, slightly less prominent or publicly visible appointments, such as EU agencies leadership positions, account for around 35% of appointments in Western and Southern Europe, but for close to 55% in Northern Europe, 62% in Eastern Europe and 82% in Central Europe. In terms of mandate durations, they represent 56% for Northern Europe, but close to 75% for Eastern Europe and over 86% for Central Europe.
Apart from EU agencies, Central Europe has only ever received two leadership appointments, twice for the Committee of the Regions. This means that Central European countries have not received a single leadership appointment for EU institutions, or Other bodies — almost only for EU agencies. Of course, agencies are essential components of the EU machinery, but their lower profile means less public awareness and recognition, and therefore a more limited feeling of representation than seeing a co-national holding a top job.
#0B5CBF;">Key figures
|
Of course, given the historical evolution of the EU’s membership and its successive rounds of enlargement, it comes as no surprise that long-term members of the EU — first and foremost, the founders and, to a lesser degree, other Southern European countries — be more represented than newcomers.
In reality, the exponential growth of the number of EU entities, and therefore of open positions and appointments, starting in the mid-90s, means that membership during prior decades did not lead to a plethora of appointments for Western and Southern Member States and does not dramatically affect the results.
Link: https://public.tableau.com/profile/eudemocracy#!/vizhome/GeographicalRepresentationinEULeadershipObservatory2021/EUentitiesovertime
Top: number of EU entities active, starting from their first leadership appointment. This number decreased twice: in 1968, following the 1967 merger of the High Authority of the European Coal and Steel Community and of the Commission of the European Atomic Energy Community with the Commission of the European Economic Community (future European Commission), and in 2009 following the 2008 termination of the European Agency for Reconstruction (this decrease was compensated by the creation of two other agencies). It shows the strong increase in EU entities starting in 1994.
Middle: number of appointments made to leadership positions since 1952.
Bottom: cumulated number of appointments since 1952.
#0B5CBF;">Key figures
|
Nevertheless, these appointments do impact our results and the analysis must therefore take this into account.
Perspectives since a fixed date
Since its inception in 1958, the EU has gone through seven successive rounds of enlargement. Two observations stick out. The first one is that not all rounds were of the same importance. In 1981 and 2013, only a single new Member State was added to the EU (Greece and Croatia, respectively). In 1986 and 2007, two Member States joined: Portugal and Spain, and Romania and Bulgaria. In 1973 and 1995, three Member States were added: Denmark, Ireland and the United Kingdom for the former, and Austria, Finland and Sweden for the latter. By contrast, the May 2004 enlargement, often referred to as the “big bang of EU enlargement”, added ten new Member States to the EU — almost as many as all other rounds combined.

Source: Júlio Reis/Kolja21 (CC-BY-SA-2.5)
The second observation is that rounds of enlargement have a clear geographical component. Prior to 2004, there were no Member States from Central and Eastern Europe, as they are defined here. In 2004, they made up half of the newcomers (alongside the Baltic States, and Malta and Cyprus). Further enlargements in 2007 and 2013 only concerned Central and European countries.
Given these observations, and since a major conclusion of this Geographical Representation in EU Leadership Observatory concerns Central and Eastern Europe, it is sensible to focus on appointments and mandate durations following May 2004.
The visualisation below narrows the dataset to appointments and mandate durations following May 2004. In order to observe the evolution of the situation, an option is provided to further narrow the dataset to periods post May 2008, 2012 and 2016. These last options therefore display the state of play in the EU respectively four, eight and twelve years following the big bang of 2004, when the situation of newcomers could be thought to have evened out compared to older members.
Despite minor variations, the main conclusion is undoubtedly that the trends noted above remain in place no matter when one starts counting. As such, Western Europe continues to dominate, with over 56% of mandate durations since 2004 and still over 51% since 2016. New appointments remain around 50% all the way through 2012 and only experience a relative decrease since 2016, with over 40% of new appointments for Western Europe.
Southern Europe easily places second with stable appointments and mandate durations, almost always hovering respectively above and just below 30%. Northern Europe is also rather stable and experiences a slow increase, with appointments rising from 8.5% since 2004 to 11.7% since 2016 and mandate durations almost reaching 10% since 2016.
Eastern and Central Europe experience encouraging increases for both mandate durations and appointments. In terms of number of appointments, Central and Eastern Europe both move steadily up from 4-5% since 2004 to 7-8% since 2016. Increases in mandate durations are slightly more limited, with Eastern Europe moving from 3.5% to 4.6% and Central Europe from 3.6% to 5.1%.
Nevertheless, both regions remaining very noticeably behind and well under the 20% equality mark. Furthermore, as noted above, EU agencies are the major source of leadership positions for Central and Eastern Europe and their figures crumble when considering other entities. As such, Central Europe’s 4.6% share of appointments falls down to 1.6%. And while the percentage rises slightly will focusing on recent years, it is only due to a more limited number of overall appointments, as Central Europe has only ever received two non-agency appointments.
Note that, while it may provide interesting and more pointed data, restricting the dataset too much (for instance, choosing both “since 2016” and a single group of entities) may make the percentages less statistically relevant.
#0B5CBF;">Key figures
|
Evolution of cumulated and yearly appointments and durations
Another way to display this information is to look at the cumulated appointments and mandate durations over time. This way, it is possible to see whether the gap between the regions grows, is stable, or tends to close. Of course, when considering percentages of total appointments or durations, figures only become meaningful after sufficient appointments have been made, which explains the drastic variations seen in the 50s.
The visualisation below shows a relative decrease of Western Europe’s dominant position starting in the early 90s, with an inflexion point following 1993 matching the increase in active EU entities. However, not only does this decrease show signs of slowing down in recent years, but it is mostly to the benefit of Southern and Northern Europe (which are, respectively, noticeably above and far below the 20% equality mark). Meanwhile, the gains of Central and Eastern Europe, while existent, remain marginal.
#0B5CBF;">Key figures
|
For the sake of completeness, the data on appointments can also be presented on a yearly basis, instead of cumulated over time as above. However, the statistically limited number of appointments in any given year (the maximum recorded was 24 in 2020) means that figures can jump up and down very quickly, limiting their analytical purpose.
For instance, Eastern Europe received six appointments in 2019 or over 27% of that year’s total. However, this impressive figure alone, clearly above the equality mark, hides the fact that the region received no position in 2020, nor a single one in the four years prior. Actually, Eastern Europe received in that single year almost as many as in all other years combined.
#0B5CBF;">Key figures
|
While these cumulated and yearly perspectives confirm that Central and Eastern Europe have been trailing since their joining the EU, it leaves a part of the puzzle aside. As such, it still considers the EU’s various regions as “equal”, without accounting for their respectively number of Member States or their population.
Accounting for regions’ number of states and population
As indicated in the map above, the regions considered are not equal: Western Europe (pre-Brexit) comprises eight Member States, while Northern Europe only has three. Likewise, Western Europe accounts for over 50% of the EU’s total population, while Central and Northern Europe barely go beyond 6% and 4% respectively.
As indicated in introduction, European Democracy Consulting does not promote the exact or strictly equal representation of every sub-groups of the European population among leadership positions — as individual qualities should prime — but instead highlights unacceptable levels of lack of representation and diversity. As a consequence, the proper size of each region must be considered and accounted for.
Since the EU’s institutional architecture oscillates between equal State representation and population-based proportional representation, these two dimensions should be observed. The visualisation below provides an option to display the share of appointments and mandate durations with regions considered “equal”, or to display them in proportion to each region’s number of Member State or population.
When calculating numbers of appointments and mandate durations in proportion to each region’s number of Member States, Western Europe experiences a notable drop in its representation (down by 11 points), owing the region’s relatively large number of States. It still remains far ahead of other regions in terms of representation, including around twice the representation of the second most-represented region, Southern Europe. Northern Europe, by contrast, more than doubles its representation, given its low number of States (from 6.8 to 14.8% of appointments and from 7.5 to 16.5% of mandate durations).
On the other hand, Southern Europe does experience a mild increase of 2-3 points but, between 25 and 30%, stays largely the same and in a solid second place. Likewise, Central and Eastern Europe experience negligible corrections (+0.7 and +0.2 points) and by and large remain at their original levels — largely under-represented.
Calculating appointments and mandate durations in proportion to regions’ population paints a very different picture. Western Europe’s lead crumbles to around 27-29% and Southern Europe loses around 3 points. Both, especially Western Europe, remain clearly above the 20% equality mark. However, both regions maintain a strong level of representation (mostly above 30%) when focusing on EU institutions and Advisory bodies.
By contrast, Northern Europe skyrockets from 6.9 to 36.6% of appointments and from 7.6 to 40.3% of mandate durations, far ahead of Western and Southern Europe and at twice the equality level. Northern European fares particularly well with EU agencies and other EU bodies.
Despite notable increases, especially for Central Europe (which boasts only 6% of the EU’s population and reaches over 8% of the appointments), Central and Eastern Europe remain in the single digits, very far from equal representation with other regions. Removing EU agencies, both regions return to values between 1.6 and 3.2% while the three others average around 30% each.
Link: https://public.tableau.com/profile/eudemocracy#!/vizhome/GeographicalRepresentationinEULeadershipObservatory2021/Prorata
Note: for the above figures, populations are considered constant. While this is obviously
not the case, it does not impact results in any meaningful way.
#0B5CBF;">Key figures
|
A more precise picture
Merging the previous two sections, the following visualisation provides the ability to narrow the dataset down to a limited time frame (since 2004, since 2008, etc.), and the calculation of appointments and mandate durations in proportion to regions’ number of Member States and population.
The previous patterns are still on display: a limited rebalancing over time that nevertheless leaves regions far from equal representation, and a slight improvement when representation is compensated by regions’ number of Member States and, particularly, their population.
However, even limiting to dataset to the past 4-5 years and factoring in populations, Central Europe remains clearly below the equality mark (with 15.3% of appointments and 13.5% of mandate durations) and Eastern Europe is far behind (with 8.4% and 5.6%, respectively). Only by restricting the data to EU agencies or by removing Other bodies does Central Europe finally skip just above the equality mark (with only ten appointments, the data for Advisory bodies alone cannot be considered statistically significant).
Link: https://public.tableau.com/profile/eudemocracy#!/vizhome/GeographicalRepresentationinEULeadershipObservatory2021/Alloptions
Note: for the above figures, the impact of Brexit is factored in Western Europe’s number of Member States and population for options starting with 2008.
#0B5CBF;">Key figures
|
Accounting for each regions membership duration, number of Member States and population gives a full picture of each region’s actual representation in EU leadership positions (or lack thereof) and of the trends at play. There nevertheless remains one last dimension to consider: the inequality of mandates obtained by regions’ Member States following their joining the Union.
Focusing on the first years of membership
It is one thing to consider the mandates obtained by a region at a given point in time, and another to put this data in the perspective of a recent accession to the EU. In order to better grasp the situation of appointments following accession, and given the differentiated dates of accession of Member States within regions, the data for this section is analysed at the Member State level.
Although appointments to leadership positions should mostly be based on individual qualities, it may be understandable, to a degree, that citizens from Member States having recently joined the EU face more difficulties — either because appointments are made from within the EU’s civil service, and they therefore lack internal experience, or, in the case of external recruitments, because they may not have had the chance to make their profiles and experience known and recognised.
So, it may be that every Members States goes through an initial dry spell, and that Central and European countries’ accession en masse simply prevented a compensation dynamic that the progressive accession of other regions allowed for. In other words, a few years following their accession to the EU, do Central and European Member States really fare worse than Member States of other regions following their own accession? The answer to this question seems a clear “yes”.

First of all, one caveat: three Member States, all from Southern Europe, have indeed gone through a very long initial dry spell. As such, Cyprus, Portugal and Greece have not had a single appointment to a leadership position in their first sixteen years of membership. Given their now-ancient accession (in 1986 and 1981 respectively), Portugal and Greece have since made up for this with twelve appointments each, but only after 2002. Cyprus, which joined in 2004, has yet to receive its first appointment.
These cases aside, the data show that, after five years of membership, two thirds of non-founding Western European Member States and all of Northern Europe have already been appointed to at least one leadership position. By contrast, only two States out of six from Eastern Europe and only one from Southern and Central Europe (out of 4 and 5, respectively) have received an appointment.
Ten years in, all Western and Northern countries have seen at least two of their own appointed. Southern Europe is mixed, with a strong Spanish presence and the continued absence of Cyprus, Portugal and Greece. In Eastern Europe, most State receive only one appointment, while Central Europe sees few appointments — with the exception of Hungary.
After sixteen years of membership, the situation persists: Western and Northern Europe see solid average appointments, Southern Europe remains very polarised, while Eastern and Central Europe have noticeably lower averages (with Poland and Hungary faring slightly better).
A further nuance can be made, since, as indicated, the exponential growth of EU entities in recent decades has translated into a drastic increase in the number of appointments. As such, there were 35 leadership appointments made in the ten years following the 1973 enlargement, but 145 within a decade of the May 2004 enlargement. As a result, it was comparatively much harder for citizens of Denmark, Ireland and the United Kingdom to be appointed to leadership positions in the first years of their membership. In other words, there is considerably more leeway today to provide all Member States with appointments and, assuming the presence of qualified candidates all across Europe, the data should reflect a more balanced representation.
The previous figures must therefore be understood in context, pro rata of the total number of appointments made during the first years after accession. In this light, the few appointments received by Central and Eastern European citizens after ten and sixteen years of membership are but a fraction of appointments received by other Member States when divided by the total number of appointments in the period considered.
Finally, even factoring in the population of each State, average values for Eastern and Central Europe remain well below Western and Northern Europe (with the exception of small outliers such as Estonia and Slovenia).
#0B5CBF;">Key figures
|
Data conclusion
As the visualisations show, the analysis of appointments to leadership position is affected by a number of factors: a region’s number of Member States, its population, the amount of time since the accession of its Member States, and the number of years taken into account, and the categories of entities considered.
Depending on these elements, values and trends will change and a number of disparities may be explained. However, one constant thread, present in all our visualisations and irrespective of changing factors, is the continued and undeniable under-representation of citizens of Central and Eastern Europe within the EU’s leadership, in particular in the most public and visible positions; 72 entities, 89 positions and close to 500 office-holders leave no place for doubt.
Ways forward and recommendations
The EU’s commitment to proper representation
The survey’s data confirm and extend last year’s identification of a continued lack of representation of citizens from Central and Eastern Europe in the EU’s leadership.
Given the enduring strength of national identities in the European Union, which form an integral part of citizens’ identity and culture, the under-representation of certain nationalities from common EU regions is not unlike other cases of under-representation in politics and public administration — for instance, that of minorities or based on gender.
The European Parliament has clearly positioned itself in favour of the proper representation of minorities. In a November 2018 resolution on minimum standards for minorities in the EU, it “encourages Member States to apply positive measures in order to ensure the proper representation of minorities [in public administration] and executive agencies at national, regional and municipal levels.” Accordingly, it “[encouraged] the Commission and the Member States to guarantee equal opportunities for national and ethnic minorities to participate in political and social life.”
More recently and focusing on the electoral side of under-representation, an own-initiative report adopted by the EU Parliament’s Committee for Constitutional Affairs “[stressed] that more needs to be done at national and European level in order to further increase the inclusion in electoral lists and the election of minorities and [called] on Member States and political parties participating in European elections to adopt proactive measures to increase the representation of under-represented groups.”
While remedies to under-representation of specific groups in legislative bodies and in public administration may be different, these declarations seem to attest of the European Parliament’s attachment to the proper representation of all segments of the European society in EU institutions.
The man in charge
While the identified lack of geographical representation is unlikely to be the result of a specific policy of discrimination, it is not generated ex nihilo either. Instead, it is the consequence of decisions made by those in charge of nominating or electing individuals in leadership positions. It is therefore essential to briefly review the bodies responsible.
Broadly speaking, the choice of EU leaders is made either by nomination or by election. Given the functioning of the European Union, the lines between nomination and election are often blurred: in many instances, an individual is, in name, elected — for instance by the European Council — but, in practice, the decision is the result of discussions and compromises, and competing candidates drop out before the vote.5 Likewise, official announcements often indicate that an individual was nominated or appointed, even when the official mechanism includes an election.

Source: Samynandpartners (CC-BY-SA-4.0)
The European Council — and therefore Member States themselves — is probably the most important body in these appointment processes. First and foremost, it decides on almost all of the EU’s top jobs: the Presidents of the European Council, of the European Commission, and of the Central Bank, as well as the High Representative of the Union for Foreign Affairs and Security Policy (HR/VP). The President of the Commission and the HR/VP are themselves instrumental in many other appointments. Of course, in theory, “the European Council, acting by a qualified majority, shall propose to the European Parliament a candidate for President of the Commission. This candidate shall be elected by the European Parliament by a majority of its component members.” (Article 17.7 TEU). In practice, the election of Ursula von der Leyen has underlined the dominance of the Council, and relegated a divided Parliament to a mere role of approval.6
In addition, the European Council appoints all other members of the European Central Bank’s Executive Council7, the European Data Protection Supervisor, the European Public Prosecutor (both with the European Parliament), and the Director of the Authority for European Political Parties and European Political Foundations (APPF, together with the Commission and Parliament). Upon nomination from Member States, the European Council also appoints the members of the European Economic and Social Committee, who in turn elect the EESC’s President.
Heads of States and Governments also act outside of the European Council. For instance, the Board of Directors of the European Investment Bank proposes a candidate for the presidency to the EIB’s Board of Governors. The Directors are nominated by Member States, while the Governors are their Finance Ministers. Likewise, the President of the Committee of the Regions is elected by the Committee’s Assembly. The Assembly’s members are elected from local and regional authorities, giving Heads of States and Governments some degree of influence, especially when stemming from the same political parties.
The European Commission is arguably the second-most important body, as it elects less prestigious but more numerous leaders. As such, it nominates the directors of the European Personnel Selection Office, the European School of Administration, the Publications Office of the European Union, the European Anti-Fraud Office (in consultation with the Council and Parliament), the directors of the six “Executive Agencies” of the Commission, as well as the entire Governing Board of the European Institute of Innovation and Technology, which appoints its own Director. It also nominates a member of the Board of Directors of the European Investment Bank and part of the Board of Directors of the European Investment Fund. Finally, it proposes candidates for approval by governing boards for the vast majority of the EU’s agencies.8
By contrast, the European Parliament has very limited powers of nomination. In addition to the approval and consultative roles mentioned before, it elects its own President and nominates the European Ombudsman.
The European Court of the Justice and European Court of Auditors are unique cases. While their judges and members are appointed, respectively, by Member States’ governments and by the Council of the European Union (upon nomination by the Member States), the judges of the ECJ can be seen as more independent in the election of the ECJ President, while ECA members vote by secret ballot.
Overall, given the decentralised and polycentric nature of the selection process of the EU’s broad leadership, measures aiming to address the identified lack of proper geographical divsersity must be internalised by a wide range of actors. However, the European Council (and, though it, the Heads of States and Governments) and the European Commission are the two institutions most able to provide the necessary political impetus and carry this process forward.
Recommendations
Remedial measures must therefore be considered by a range of actors, but first and foremost by the European Council — meaning the Heads of States and Governments — and the European Commission. There must be an in-depth discussion between these two bodies resulting in a joint commitment declaration with clear action points. Understandably, given the sensitivity and political nature of this issue, it may be easier to agree on broad objectives rather than on concrete figures. Here are necessary acknowledgements and actionable recommendations for action that should feature in this declaration.
1. Acknowledge the lack of proper geographical representation in the EU’s leadership
The first step in addressing under-representation is to acknowledge its existence. This Observatory lists ample and verifiable data highlighting the almost complete lack of representation of Central and Eastern European citizens in EU leadership positions, especially at the highest levels. The Council and Commission may decide that appointments ought to be made solely based on competence, and that the observed lack of geographical representation is a consequence of this policy. However, with Central and Eastern Europe representing 40% of Member States and 20% of the EU’s population, their almost complete absence from EU leadership positions becomes indefensible. The Council and Commission should use these results and acknowledge the imbalances identified.
2. Acknowledge the likely negative impact of this lack of proper geographical representation
Several countries in Central and Eastern Europe — first and foremost, Hungary and Poland — have given rise to illiberal-minded governments which have repeatedly acted to undermine the rule of law, a treaty-enshrined value of the European Union.9 The limited participation of these regions in European elections should also be a concern: in 2019, nine out of eleven countries from Central and Eastern Europe were under the EU’s average turnout — part of the thirteen least-voting countries —, and four out of five Central European countries were the four least-voting countries in the EU, with rates ranging from 30 down to 23%. These two regions have a noticeably lower turnout than the other three. While there are a number of other factors at play, it is clear that the absence of these countries from leadership positions is sure to further alienate their citizens from the Union.
Link: https://public.tableau.com/profile/eudemocracy#!/vizhome/GeographicalRepresentationinEULeadershipObservatory2021/TurnoutEP2019
The United Kingdom is not featured here, since the its impending departure from the Union largely contributed to its extremely low level of voter turnout.
3. Acknowledge the Council and Commission’s central role in appointments and, therefore, in the improvement of geographical representation
Last but not least, the Council and Commission, by virtue of the European treaties and of EU entities’ statues, must acknowledge their direct and primary position in the filling of leadership positions and, therefore, their inescapable role in addressing and remedying the lack of proper geographical representation in the EU’s leadership.
4. Establish dimensions of analysis and baseline measures
In order to start addressing the identified lack of representation, the Council and Commission need to know from where they start. They must first identify the dimensions along which the level of proper representation will be assessed. The Observatory highlights a number of measures that can be used: overall representation since the EU’s founding (objectively the least useful dimension), representation since a specific date, representation proportionally to regions’ number of Member States or population, and representation following a number of years of membership. All these dimensions were considered from the perspective of appointments and mandate durations, and broken down by groups of institutions. They can be re-used for the Council and Commission’s analysis.
However, the survey focuses only on successful elections and appointments, and baseline measures must go beyond publicly available data. In addition, the Council and Commission must look at steps ahead of elections and appointments. In the case of elections, the number of candidates from each region and their rate of success. In the case of appointments, and depending on the precise mechanism, the number of candidates from each region considered for a short list, the number of candidates from each region making it to the short list, and their eventual rate of success.
Going one step further, the Council and Commission must consider the current representation of each region among EU civil servants — disaggregated not only by institution, but also by position level — which forms a large pool for non-political appointments. This should cover both career civil servants and contractual staff members.
5. Establish goals and targets
Once these various dimensions and measures have been established, the Council and Commission must agree on their objectives, including a clear long-term goal and one or more time-bound intermediary goals.
As indicated earlier, European Democracy Consulting does not promote the strict equality of representation for Member States or regions, as this would put an unwelcome constraint on hires, which ought to remain guided first and foremost by individual competence. Instead, the Council and Commission should commit to a set of flexible targets. For instance, “by 2030, over a running three-year period, each region’s share of appointments pro rata of its population should range between 15 and 25%” (all regions receiving 20% would mean strict equality).
Similar goals must be divised for dimensions not surveyed by the Observatory and presented in the points above. All of these should be further refined by institution type, and be given intermediary goals over the next decade.
6. Define actions
Once goals have been set, the Council and Commission must delineate clear actions they will take to achieve them.
Ensuring transparency is a precondition for action. While most EU entities already disclose information on their current executive leadership, information on previous leaders is limited, and often times scarce or entirely missing on the details of the selection process. This should be remedied to as part of good governance measures on transparency. While information on short-listed or competing candidates needs not be publicly available, related statistics should be collected in a relevant yearly publication.
Beyond transparency, affirmative action policies are the most obvious proposal and are already used to address other instances of under-representation. In 1997, the Inter-Parliamentary Union (of which all European national parliaments are members, in addition to the European Parliament as an associate member) indicated in its “Plan of Action” on gender representation that “on a strictly interim basis, affirmative action measures may be taken. Wherever the measure chosen is a quota system, it is proposed that the quota should not target women, but that, in the spirit of equity, it may be established that neither sex may occupy a proportion of seats inferior to a given percentage.”
While affirmative action may be politically divisive, the Charter of Fundamental Rights of the European Union already states that “the principle of equality shall not prevent the maintenance or adoption of measures providing for specific advantages in favour of the under-represented sex” (Article 23). EU institutions have also repeatedly supported measures of this nature. In 2012, the European Parliament welcomed parity systems and gender quotas introduced in some Member States and urged others to consider legislating to facilitate gender balance in political decision-making.10 The Commission’s Gender Equality Strategy 2020-2025 includes equality between women and men in decision-making as a priority objective, setting out soft law measures, including data-collection. Finally, the Council has called upon the Commission, governments, political parties and the European and national parliaments to promote a gender-balanced representation, for example by introducing gender-alternate lists.
Similar temporary measures may be taken to ensure proper geographical representation in the EU’s leadership. For instance, “by 2030, over a running three-year period, each region should not received a number of appointments less than two-thirds or more than one-third of their population share, with a maximum spread of 10 points.” For example, for each three-year period considered, Eastern European citizens, who make up 13.7% of the EU’s population, should not receive less than 9% of leadership appointments; Southern European citizens, who make up 25.3% of the EU’s population, should not receive more than 34% of leadership appointments.
Link: https://public.tableau.com/profile/eudemocracy#!/vizhome/GeographicalRepresentationinEULeadershipObservatory2021/Three-yearperiods
Dark lines show the number of appointments for each region for running three-year periods; light ones show the minimum and maximum recommended appointments based on each region’s population. Given the short time period considered, the 2018-2020 bracket accounts for Western Europe’s post-Brexit population change.
Of course, numbers alone do not fully do justice to proper representation, as different entities have different levels of prestige and public visibility. As such, increasing the number of Central and Eastern Europeans in leadership positions is important, but it is likely to fall short of true proper representation if appointments only concern EU agencies while all top job positions are attributed to Western and Southern Europeans.
In addition to quotas, which focus exclusively on the outcome of the selection process, other measures must be adopted upstream. This includes the overall promotion of diversity among the EU’s public administration. This representation cannot simply be measured as an aggregate, but be ensured across all hierarchical levels, including the ones leading to consideration for leadership positions.
In its 2009 report on Fostering Diversity in the Public Service, the OECD describes diversity “not only as the mixture of backgrounds and competences but also as valuing and using people’s competences, experience, and perspectives to improve government efficiency and effectiveness, and to meet public servants professional expectations.” It highlights a “growing consensus […] that pursuing diversity may also help to preserve core public service values such as fairness, transparency, impartiality and representativeness.” The report notes “a growing tendency to see diversity as an asset rather than as a problem” and encourages governments to include diversity principles “part of any public management reform, as diversity initiatives cannot succeed as an isolated strategy.”
In particular, measures should be considered to “make the recruitment process fairer, more transparent and more flexible to attract talented people with a mix of backgrounds, experience and perspectives. Improvements to the recruitment process refer to the instruments or mechanisms that aim to: i) diversify the communication channels to reach a wider audience; ii) motivate people to apply for vacancies in the public service; iii) relax the selection process and criteria to make them more inclusive but still focused on analysing skills, qualities and competencies required for the job; and iv) facilitate the integration and retention of new recruits to the workplace.”
In a 2019 survey on Managing a diverse public administration or effectively responding to the needs of a more diverse workforce, the OECD further encourages governments to go “beyond technical efficiency to the creation of public value where the civil service aims to deliver better services to all and strengthen the legitimacy of, and confidence in, public sector institutions in the eyes of the public. It suggests the need to design more diverse and inclusive policies and services, supported by more diverse and inclusive public sector institutions. A representative public sector workforce also sends a strong message of inclusion, that public sector institutions are serious about taking all of their citizens’ concerns to heart and designing policies and programs that meet their needs.”
Beyond the Council and Commission, these measures highlight the special role to be played by the European Personnel Selection Office (EPSO), as the office responsible for selecting staff for all institutions, bodies and agencies of the European Union, and the European School of Administration (EUSA), which organises training programmes for staff of EU institutions, bodies and agencies.
7. Track progress publicly
Finally, once actions have been decided, progress along the dimensions identified earlier must be periodically assessed and made public, at least on a yearly basis. If need be, the dimensions themselves may be reviewed and improved in order to better track the impact of the actions taken, and actions should be amended as necessary to ensure long-term objectives are met.
Public scrutiny and clear lines of responsibility, in particular of the Council and Commission, must be guaranteed to ensure that the relevant actors are held accountable. We aim for this Geographical Representation in EU Leadership Observatory to be a significant and useful first step in this direction.
About European Democracy Consulting
European Democracy Consulting is a consulting firm specialising on the provision of legal and political expertise on institutional and constitutional matters. Our goal is the strengthening of European democracy through reform and the application of best-practice measures.
OUR HISTORY
European Democracy Consulting was created in 2019, out of the desire to improve our European democracy. The 2019 European elections have shown a renewed interest for our Union, but also the limits of citizens’ engagement. Following these elections, European Democracy Consulting was set up to help decision-makers, public institutions, and NGOs in their promotion of a more democratic, transparent and efficient European Union.
OUR VISION
Democracy does not always come easy; there may be vested interests opposing its development. As a result, sixty years after its creation, the European Union still falls far short of the democratic standards of developed countries.
We wish to bring our solid expertise to support a value-based discussion and propose concrete political and legal solutions, based on best-practices, that will strengthen our common democracy for the general interest of all Europeans.
About the author

Founder
Louis has spent over seven years working for international organisations, including the United Nations, the European Union, and the Council of Europe. Through these positions, he has acquired a solid expertise in and knowledge of institutions and public policy.
In recent years, he has devoted an increasing part of his time to the reform of European institutions and governance. This included the drafting of a European constitution and the creation of a related non-profit, EuropeanConstitution.eu, as well as a number of policy papers on the reform of European elections and parties.
If you are interested in our data analysis and visualisation work, reach out to us and check our reviews of elections cycles in Europe and the results of the 2019 European elections from the perspective of European parties.
- “[Political disaffection has] to do with negative attitudes and behavioural patterns of people towards the universe, their fellow citizens, political life in general, political institutions (above all parties and party elites), and the practice of citizenship (such, as a minimum, voting). [Dis-affection] in politics also refers to the primarily emotional and passionate(rather than cognitive) condition of absence of a ‘sense of belonging’, not ‘feeling-at-home’ in the political community, marginalization, perceived lack of representation, institutionally mediated lack of capability to make one’s voice heard, deprivation of political resources, lack of horizontal and vertical trust, profound aversion to the political order, etc.” Claus Offe, Political disaffection as an outcome of institutional practices?, in Torcal, Mariano and J. R. Montero (eds.), Political Disaffection in Contemporary Democracies. Social Capital, institutions, and politics, 2006
- European Council, Special meeting of the European Council (30 June, 1 and 2 July 2019) – Conclusions, https://data.consilium.europa.eu/doc/document/ST-18-2019-INIT/en/pdf
- Given the long history and evolving administrative and legal structure of the European Union, many EU entities have transformed since their inception. There are four broad categories of changes: i) an independent EU entity succeeding another independent EU entity, ii) an independent EU entity created from an EU entity without its own legal personality, iii) an independent EU entity succeeding a non-EU entity, and iv) an independent EU entity merely changing its name (often reflecting internal administrative changes).
- EU entity succeeding another independent EU entity (recorded from inception)
- Common Assembly (1952) > European Parliamentary Assembly (1958) > European Parliament (EP, 1962)
- High Authority of the European Coal and Steel Community (1952), Commission of the European Atomic Energy Community (1958), and Commission of the European Economic Community (1958) > Commission of the European Communities (1967) > European Commission (EC, 2009)
- High Representative for Common Foreign and Security Policy (1999) > High Representative of the Union for Foreign Affairs and Security Policy (HR/VP, 2009)
- Europol Drugs Unit (EDU, 1993) > European Police Office (EUROPOL, 1999) > European Union Agency for Law Enforcement Cooperation (2009, kept its acronym)
- European Agency for the Management of Operational Cooperation at the External Borders (Frontex, 2004) > European Border and Coast Guard Agency (2016, kept its acronym)
- GALILEO Joint Undertaking (GJU, 2002) > European GNSS Supervisory Authority (GSA, 2004) > European Global Navigation Satellite Systems Agency (2010, kept its acronym)
- Trans-European Transport Network Executive Agency (TEN-T EA, 2007) > Innovation and Networks Executive Agency (INEA, 2013)
- European Monetary Cooperation Fund (EMCF, 1973) > European Monetary Institute (EMI, 1994) > European Central Bank (1998): recorded from the creation of the EMI, as the EMCF quickly moved to a de facto rotating chairmanship (see Command and Control in the Committee of the Governors, David M. Andrews, European University Institute, March 2003, http://aei.pitt.edu/2811/1/078.pdf)
- EU entity created from an non-independent EU entity (recorded from independence)
- Commission on Racism and Xenophobia (CRX, 1994) > European Monitoring Centre on Racism and Xenophobia (EUMC, 1998) > European Union Agency for Fundamental Rights (FRA, 2007)
- Unité de coordination de lutte anti-fraude (UCLAF, 1988) > European Anti-Fraud Office (OLAF, 1999)
- The three Level-3 Committees of the Lamfalussy process on financial service industry regulations:
- Committee of European Banking Supervisors (CEBS, 2004) > European Banking Authority (EBA, 2011)
- Committee of European Insurance and Occupational Pensions Supervisors (CEIOPS, 2004) > European Insurance and Occupational Pensions Authority (EIOPA, 2011)
- Committee of European Securities Regulators (CESR, 2001) > European Securities and Markets Authority (ESMA, 2011)
- EU entity succeeding a non-EU entity (recorded from integration to the EU)
- Western European Union Satellite Centre (WEUSC, 1992) > European Union Satellite Centre (EU SatCen, 2002)
- Western European Union Institute for Security Studies (WEU-ISS, 1989) > European Union Institute for Security Studies (EUISS, 2001)
- EU entity changing its name (recorded from inception)
- Public Health Executive Agency (PHEA, 2005) > Consumers, Health, Agriculture and Food Executive Agency (CHAFEA, 2008)
- European Network and Information Security Agency (ENISA, 2004) > European Union Agency for Cybersecurity (2019, kept its acronym)
- European Railway Agency (ERA, 2004) > European Union Agency for Railways (2016, kept its acronym)
- Office for Harmonization in the Internal Market (OHIM, 1994) > European Union Intellectual Property Office (EUIPO, 2016)
- Pro-Eurojust (2000) > Eurojust (2002)
- European Union Satellite Centre (EUSC) > European Union Satellite Centre (EU SatCen), change of acronym only
- EU entity succeeding another independent EU entity (recorded from inception)
- The European Central Bank is a particular case, in that its composition is the Eurozone and not the full European Union — leaving aside Bulgaria, Croatia, the Czech Republic, Denmark, Hungary, Poland, Romania, and Sweden. Using our classification, Central and Eastern European countries belonging to the Eurozone are: Estonia, Latvia, Lithuania, Slovakia, and Slovenia.
- For instance, Article 15.5 of the Treaty on European Union states that “The European Council shall elect its President, by a qualified majority, for a term of two and a half years, renewable once.” However, in practice, the President of the European Council is announced as part of a series of top job appointments, and not the result of a truly competitive election.
- Maïa de la Baume, “Von der Leyen’s nomination gets mixed reviews from MEPs”, POLITICO Europe, 2 July 2019, https://www.politico.eu/article/urusla-von-der-leyen-european-parliament-reaction
- ESCB Statute, Article 11.2, https://www.ecb.europa.eu/ecb/pdf/orga/escbstatutes_en.pdf
- Inter-institutional Working Group on regulatory agencies, Appointment and dismissal of the Director, https://europa.eu/european-union/sites/europaeu/files/docs/body/fiche_7_sent_to_ep_cons_2010-12-15_en.pdf
- Treaty on European Union, Article 2: “The Union is founded on the values of respect for human dignity, freedom, democracy, equality, the rule of law and respect for human rights, including the rights of persons belonging to minorities. These values are common to the Member States in a society in which pluralism, non-discrimination, tolerance, justice, solidarity and equality between women and men prevail.”
- European Parliamentary Research Service, Women in politics in the EU State of play, 2019, https://www.europarl.europa.eu/RegData/etudes/BRIE/2019/635548/EPRS_BRI(2019)635548_EN.pdf
Pingback: STUDIU. Est-europenii nu sunt suficient reprezentați în instituțiile Uniunii - Editia de Dimineata
Pingback: LA RAPPRESENTANZA GEOGRAFICA NELLA LEADERSHIP DELL’UNIONE EUROPEA – IARI
Pingback: GRELO2024 – EDC