Following European elections, national authorities focus on national results, while the European Parliament presents its parliamentary groups — leaving aside the supposedly core actors of European politics: European political parties. European Democracy Consulting is therefore proud to introduce unique data and visualisations on the outcome of the 2019 European elections, as seen from the perspective of European parties. Dive in!
The European election, last May, was undoubtedly the major political element of 2019. Campaigns were fierce, the outcome closely observed, and its consequences ran until the end of the year with the arrival of the new Commission. Yet, one group of stakeholders was scarcely mentioned: European political parties.
European political parties are the great unknown of the European political system. In theory, we vote for them every five years; in practice, few of us ever hear their name. PES, EDP, EGP, ECPM, or PEL, an alphabet soup struggling in the dark.
Comes election night, citizens have their eyes fixed on the results of their national parties. Comes the next morning, the parliamentary groups start counting their numbers. Lost in between, European parties receive little love or attention.
So there are European parties and European parliamentary groups? Yes, and this should not surprise us, as this system mirrors the functioning of our national political systems:
- political parties are organisations presenting candidates for elections, developing and defending ideas to citizens, and mobilising militants on the ground; we know their names and their leaders.
- parliamentary groups are entities only within legislative houses; they are usually less well-known and their leaders are subservient to party leaders.
European parties come in two flavours: official and unofficial. Given the high bar to register as an official European party (including having an MEP, Member of Parliament, or Member of a Regional Parliament in at least seven Member States, or reaching 3% of the vote in the most recent European elections in at least seven Member States), many smaller parties or newcomers are not officially registered. We here include both registered and non-registered European parties. However, where a national party is a member of a registered European party and of a non-registered party, the registered membership takes precedence.
Registered (above) and non-registered (below) European parties
Nevertheless, between the weight of national parties, at the national level, and that of Heads of State, at the European level, strong European parties have failed to emerge. While parliamentary groups sprang to life with the creation of the European Assembly in the 1950s, European parties waited until the first election of the European Parliament by universal suffrage in 1979 and have remained in the shadow of parliamentary groups ever since.
European political parties (left) and their respective groups in the European Parliament (right)
As a result, following European elections, national authorities focus on the results of national parties, while the European Parliament lists the performance of its own groups, and little mind is paid to the results of European parties.
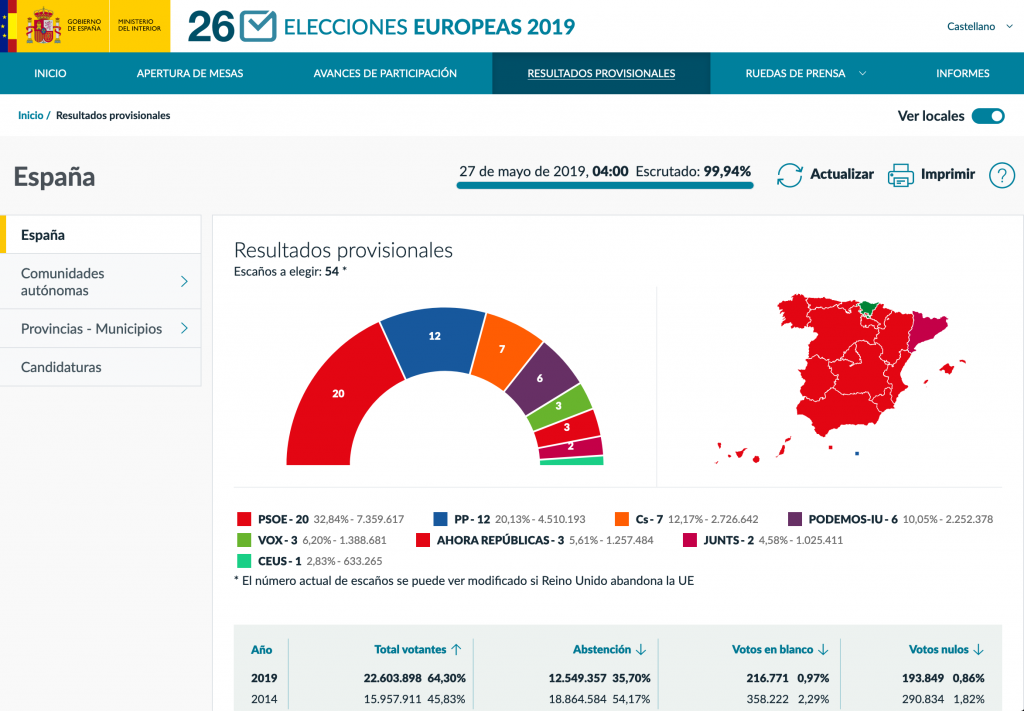

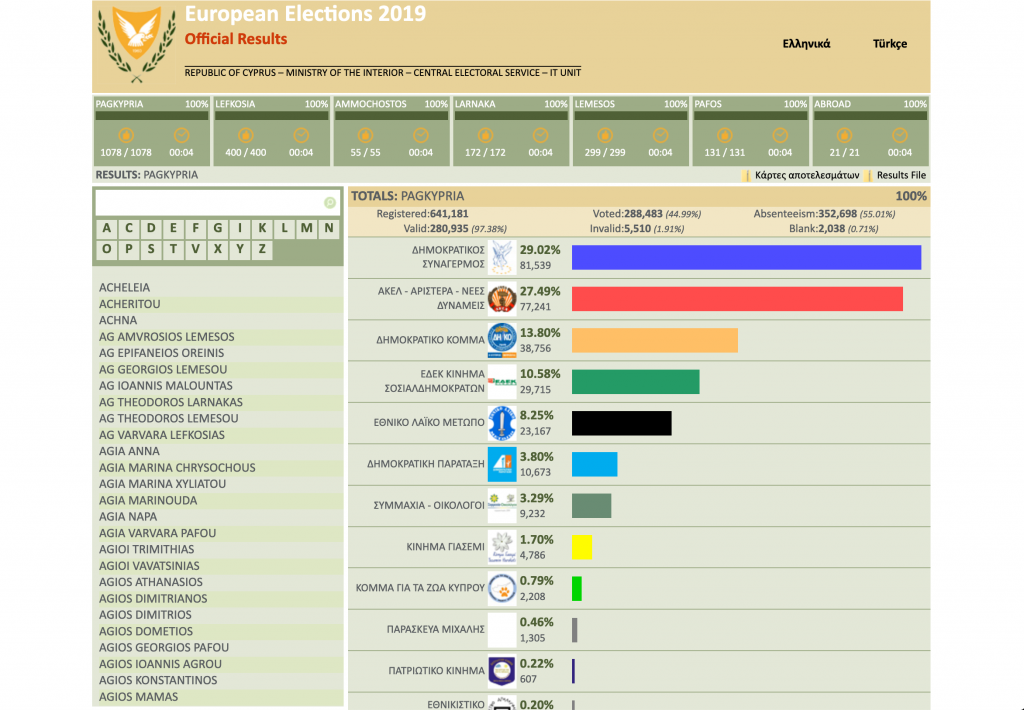
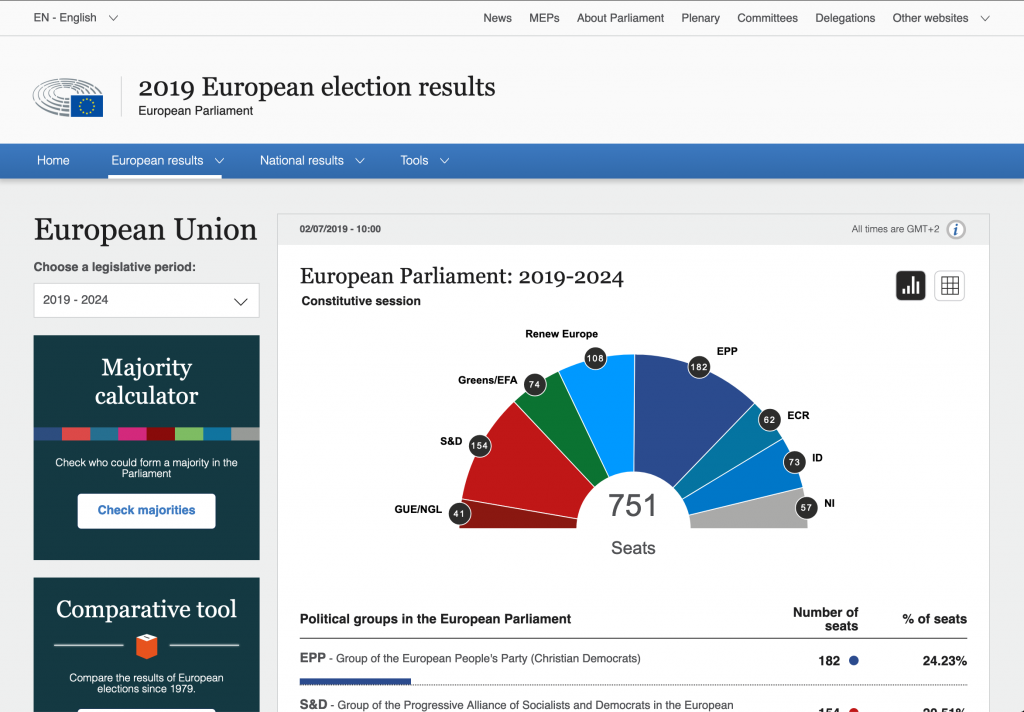
National result websites and website of the European Parliament
While many do not realise it, this limited knowledge of European parties is particularly damaging for European citizens, as these are the political parties we vote for in fine. And it is upon their programme, and not that of national parties, that our representatives will vote in Parliament. Without increased understanding of these parties, two European citizens from different countries may vote for the same European party, but for noticeably different political programmes.
As a first step in increasing knowledge about European parties, we have carried out a thorough data collection effort in all 28 Member States (at the time of the previous election) and here present a unique overview of the 2019 European elections’ results, as seen from the perspective of European parties.
As for our methodology, we pooled all official electoral results from the relevant websites in each Member State, and verified the membership of national parties to European parties. This allowed us to assign to each national party its European party of affiliation and sum up their performance. Since many national parties are not official members of a European party (even though they may sit in the same parliamentary group), a notable fraction of the vote does not belong to any European party.
This process proved difficult in the case of coalitions. Where two or more national parties ran together, but only one of them belonged to a European party, we chose to attribute the score to this European party. Where several of the coalition partners belonged to different European parties, we split the results between the European parties in question.
In order to fully appreciate the meaning of the results of the 2019 European elections, we have chosen five dimensions: the vote count, the MEP count, EU public funding, the voter turnout, and the leading party per Member State. In case the visualisations fail to display, links are provided below.
The vote count
Undoubtedly, the first result one looks at following an election is the number of votes received by each party. As we have mentioned, this is usually done at the level of national parties and, a little later, at the level of parliamentary groups. Here, we look at the results at the level of European parties for each country, for the EU as a whole, and for the post-Brexit EU-27.
Link: https://public.tableau.com/views/EP2019Results/EP2019Results
This data reveal some interesting elements. First of all, the proximity of the EPP and PES at the European level, respectively with 37 and 35.3 million votes for their member parties, a small 4.6% difference. When contrasted with these parties’ number of MEPs (185 and 142, a 23.2% difference), these figures highlights the lack of proportionality of the European elections — despite using proportional voting methods in most Member States.
Another interesting figure is the weight of non-affiliated parties, gathering a whopping 32.3 million votes, or 16.4%, and placing third behind the EPP and PES. This importance of non-affiliated parties indicates, a contrario, how much the lines could change for European parties if these national parties could be convinced to join the fray, either in the creation of new European parties or in boosting existing ones. Either way, this shows that the current European party system fails to properly account for the opinion of voters.
The MEP count
Following the election, votes translate to MEPs. However, with Member States imposing electoral thresholds and given the limited number of MEPs in smaller States, the number of MEPs is not directly proportionate to each party’s votes. It is also interesting to compare each party’s number of MEPs with the MEPs of corresponding parliamentary groups.
Link: https://public.tableau.com/views/EP2019Results/MEPsforEuropeanpartiesandparliamentarygroups
This data gives us a clue as to where some non-affiliated parties stand, as many choose to join an established parliamentary group with a clear political coloration. While the EPP and PES/S&D see little change between the MEPs affiliated to their party and those affiliated to their parliamentary group (+2 for the EPP, +5 for the PES/S&D in the post-Brexit setting), out of the 82 MEPs from non-affiliated parties, only 29 remain “non-inscrits” (NI) once in Parliament.
Liberals are among the main winners, with 66 MEPs affiliated to ALDE and 9 to the EDP, but 98 MEPs joining Renew Europe — a clear influence of Emmanuel Macron’s En Marche party. Far-right parties also benefit from non-affiliated parties, with ID picking up 15 extra seats (from 61 to 76), and the ECR 10 seats (from 51 to 61). The flip side of this argument is these parties’ inability to convince non-affiliated national parties to become legal members of European parties, instead of simply joining a parliamentary group.
By constrast, most of the 13-seat increase between the EGP and the Greens/EFA group is not made up by non-affiliated parties, but by non-green European parties, most of them non-registered, including the EFA (4), the European Pirate Party (4), Animal Politics EU (3) and Volt (1).
EU public funding
The funding of European parties is described in Regulation 1141/2014 on the statute and funding of European political parties and European political foundations, amended in 2018 and 2019.
According to this Regulation, registered European political parties can apply for public funding from the European Union. Every year, a total funding envelope is determined by the European Parliament; 10% of it is distributed equally to all registered parties qualifying for funding, and the remaining 90% is distributed as a proportion of parties’ MEPs.
As a result, the funding of European parties is extremely dependent on their electoral results. Extrapolating from past increases, we can make projections on the future funding envelope and, using our MEP results, estimate public funding for European parties for the coming years.
Link: https://public.tableau.com/views/EP2019Results/EUPublicFundingforEuropeanparties
While the projected growth rate for the total envelope of EU funding may not materialise, the data highlights that, despite heavy electoral losses, the EPP and PES are unlikely to suffer major financial downturns. We see two reasons for this. First, the withdrawal of the UK means a decrease in the sheer size of Parliament, and the arrival of new members. Since few of outgoing British MEPs were affiliated to the EPP and PES, while incoming members were, this means a proportional increase of these parties’ size in the new smaller format. For instance, the EPP party’s share of MEPs before the election was 28.5%; following the election, it shrank to 23.7% but rebounded to 26.2% after Brexit.
Second, the big losses that were mentioned concerned the parliamentary groups and, while this impacts policy-making in the European Parliament, it does not affect the funding of European parties. For instance, while the S&D group lost 44 MEPs between 2018 and 2020 (23% of its MEPs), the PES “only” lost 31 members (18%), helping cushion the blow. As a result, the PES only went from a share 27.9% of MEPs affiliated to registered parties down to 23.5%.
Nevertheless, despite poor electoral performances, these parties will not suffer financial consequences. Meanwhile, smaller parties fairing better remain unable to benefit from their performance, as the bar for registration as a European party (and, therefore, to qualify for EU public funding) remains exceedingly high. A clear example is Volt, which managed, in the span of only two-three years, to create chapters in every single Member State (including 13 officially registered as political parties), and to receive close to half a million votes. However, since it only elected a single MEP, it remains unable to register as a European party.
Voter turnout
Voter turnout is not a new information per se, as it was already available with the reveal of national results, but it may be used to disaggregate data on votes received by European parties.
Link: https://public.tableau.com/views/EP2019Results/VoterturnoutatEP2019
Fourteen Member States — half, at the time of the vote — experienced a turnout over the European average of 49%. Therefore, we can further breakdown the results of the votes in Member States above and below this average, by party and by ideological group.
Link: https://public.tableau.com/views/EP2019Results/EP2019Resultswithturnout
Link: https://public.tableau.com/views/EP2019Results/EP2019Resultswithturnoutbygroup
Overall, there does not seem to be a strong correlation between a lower voter turnout and the strength of specific parties or groups of parties. However, as a loose trend, we do observe specific differences.
While right-wing parties, as a broad group fare sensibly the same, the EPP plummets from 20.5% in Member States above the EU turnout average down to 13.9% in Member States below. Likewise, the PES, and left-wing parties generally, fare noticeably worse, with left-wing parties crumbling from 25.5% in Member States above the turnout average down to only 16.2% for Member States below. By contrast, non-affiliated parties and the ECR receive much higher scores in Member States with lower turnout rates (from 13.8% to 23.7%, and from 11% to 17.3%).
Governing party and leading party
Finally, another consequence of European elections is the nomination of the new European Commission. In the absence of a real Spitzenkandidat system, the choice of the President of the Commission, bundled with a few other top jobs, is the result of a negotiation between Member States. However, each Member State nominates its own commissioner. In theory, President-elect Ursula von der Leyen asked Member States to provide several names, including at least one man and one woman; in practice, many Member States simply provided a single name.
What is interesting is that, even though the nomination of the commissioners takes place soon after the European election, those nominating commissioners are the governments in place, meaning these nominations have nothing to do with the outcome of the election; governments may have just been voted in, or on the verge of leaving.
It is therefore illuminating to see in which Member States the governing party, which nominated the commissioner, was also a leading party at the European elections.
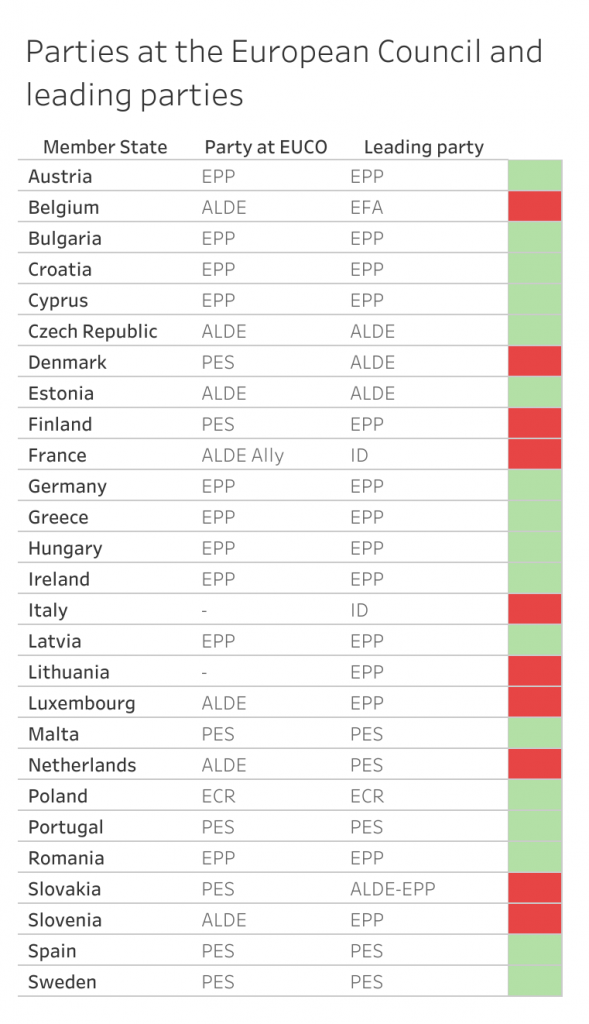
Link: https://public.tableau.com/views/EP2019Results/Partiesingovernementandleadingparties
Two special cases stand out. In Lithuania’s semi-presidential system, the President, Prime Minister, and a majority of the Cabinet are independents; the EPP placed first in the election. In Italy’s parliamentary system, the Prime Minister is an independent, while his cabinet is a coalition of a PES party and a non-affiliated party; ID Party placed first in the election.
Overall, out of the 27 Member States nominating commissioners, ten (or 37%) had a different party sitting in the European Council from the one winning the election (eleven with the United Kingdom, or 39%). While this remains a minority, it contributes to entrenching a distance between citizens, seen as European voters, and the choice of their European executive. This disconnect strengthens the perception of European elections as having limited consequences, thereby contributing to a generally low voter interest and turnout.
For a party-centric view of European politics
At the time of writing, the above data is unique. European political parties are such second-class political stakeholders that no one has bothered going through the records to see what they election meant from their perspective.
From the dimensions we observed, we found interesting conclusion. First of all, despite a gap between them in the number of MEPs, we have seen that the EPP and PES received very close numbers of votes. This shows that our electoral system does not, in fact, ensure a proportional outcome and should lead us to consider reforming of the EU’s electoral law.
We have seen the very high weight of national parties that are not affiliated to any European party. This is damaging to the clarity of their position, as voters are less likely to know what political agenda they will support once in Parliament and who they will sit with. This should lead us to consider reforming the Regulation on European political parties, as a way to increase European party membership.
We have seen that, regardless of their poor electoral performances, major parties were unlikely to face a decrease in their public funding. Meanwhile, given the high bar for registration as a European party — and, therefore, to qualify for public funding —, smaller parties or newcomers remain unregistered and, despite positive electoral performances, must continue to operate without public funding. There are several components to public funding schemes, but rewarding electoral performance should be one of them, and the current EU public funding scheme is failing in this regard. This should lead us to consider reforming the EU’s provisions on the registration and funding of European parties.
Finally, we have seen that close to 40% of European commissioners were nominated by governments who had just lost the European election. In parliamentary systems, elections serve not only to populate the legislative houses, but also to decide on the executive. In order to improve on our democratic governance and give due weight to citizens’ vote, we must ensure a link between the result of the vote and the choice of our European executive, including commissioners. This should lead us to consider reforming the way the entire Commission is nominated, not just its President.
From these reforms — of the EU’s electoral law, of the Regulation on European parties, of their registration and funding, and of the way the entire Commission is nominated — we can accomplish a more democratic Union. In order to achieve this, however, it is high time to shift the focus of European politics away from national parties and parliamentary group, and finally centre the European political system on what ought to be its real core: European political parties.
~
Do you want concrete proposals to address this issue? European Democracy Consulting can help. Contact us for more.