Following European elections, national authorities and commentators focus on results from two complementary angles: the results of national political parties in each member state, and those of parliamentary groups in the European Parliament. As always, this leaves aside a supposedly core group of actors in a representative democracy: European political parties. European Democracy Consulting is therefore proud to introduce unique data and visualisations on the outcome of the 2024 European elections, as seen from the perspective of European parties. Dive in!
Despite elections taking place around the world, the 2024 European elections were undoubtedly the major political event of the year for the EU. Despite a slow start and the absence of strong EU-level contenders, campaigns proved fierce, the outcome was closely observed, and consequences continue to unfold with the appointment of the so-called “top jobs” (watch out for geographical representation) and the nomination of the new Commission. Yet, one group of stakeholders was scarcely mentioned during this campaign: European political parties.
European parties remain the great unknown of the European political system. In theory, we vote for them every five years; in practice, few Europeans know what they stand for, or ever hear their names: PES, EDP, EGP, ECPM, or PEL, an alphabet soup struggling in the dark.
Comes election night, citizens have their eyes fixed on the results of their national parties. Comes the next morning, political groups in the European Parliament start counting their numbers and making the math. Lost in between, European parties receive little love or attention, as their almost non-existent campaign donations already indicated. For the second time, European Democracy Consulting is working to shed light on European parties’ own electoral performance.
Note: following improvements in reporting by national entities and in our methodology, our 2024 results are more accurate than those of 2019. Results for 2019 should therefore be considered as informative and not as exact figures.
Main conclusions
- National parties not affiliated to European political parties come out ahead of all European parties, with over 24% of all votes cast. The European People’s Party (EPP) comes second with 21.8%, and the Party of European Socialists a distant third with 16.9%.
- All three lose votes, alongside the Alliance of Liberals and Democracy for Europe (ALDE) and the European Green Party (EGP). The PES loses 6 million votes, while the EGP and ALDE lose, respectively, 34 and 50% of their votes. Meanwhile, the European Conservative and Reformist Party (ECR) and the Identity and Democracy Party (ID) both increase their vote count and their share of the vote.
- Losses are cushioned in terms of MEPs, especially for the PES and ALDE which both manage to increase their number of MEPs despite electoral downturns.
- European public funding, which accounts for 85-90% of European parties’ income, is unlikely to change significantly, as it is not based on European parties’ vote count.
- Voter turnout is extremely volatile, but decreases in many member states; Central and Eastern Europe vote less than other regions.
- Close to 10 million votes are discarded due to legal thresholds, especially in larger member states, dealing a blow to political pluralism, and several member states, including Romania, France or Luxembourg, feature high numbers or shares of invalid votes.
- Finally, despite improvements in electoral reporting, analysing votes from the perspective of European parties remains extremely challenging.
Recommendations
- The EU’s electoral law should be reformed in order to ensure EU-wide party proportionality, and to make European citizens properly aware of the European party affiliation of national parties and candidates. Our current 27 national electoral frameworks are an impediment on both counts.
- The Regulation on European political parties should be reviewed to make it easier for pan-European political alliances to register as European parties, to better link European public funding to electoral performance, and to increase party membership.
- Voting modalities should be harmonised across member states in order to ensure European citizens’ equality before the vote at their one chance at choosing their law-makers as citizens of the same Union; European elections should be managed by a European electoral commission, and results should be consolidated in an EU-wide register.
Who is who
Let us start with the usual reminder that the EU comprises both European political parties and political groups in the European Parliament. These entities are clearly separate, and have different and well-defined roles.
The same distinction is found at the national level. Political parties are organisations presenting candidates for elections, developing and defending ideas to citizens, and mobilising militants on the ground; we know their names and usually that of their leaders. Parliamentary groups, on the other hand, are entities only within legislative houses; they are usually less well-known and their leaders are subservient to party leaders.
Of course, the distinction is not always so strict, and party leaders may well also hold the role of parliamentary group leaders — which is also the case, at the European level, for the EPP and the EPP Group. Nevertheless, this division of roles is often found across member states and applies to the European level as well. At this level, however, parliamentary groups have historically had more visibility than political parties.
European political parties have a recognised institutional place in the EU: they officially register with the Authority for European political parties and European political foundations (APPF), have a treaty-mandated role (to “contribute to forming European political awareness and to expressing the will of citizens of the Union”), and receive public funding from the budget of the Union.
However, given the high bar to register as a European party (including having an MEP, Member of Parliament, or Member of a Regional Parliament in at least seven member states, or reaching 3% of the vote in the most recent European elections in at least seven member states), several smaller political alliances (groups of national parties or citizens) fail to register as European political parties.

Our analysis focuses on European political parties. However, in order to give a fuller picture of the vote, we include three political alliances clearly campaigning across Europe, but not registered as European political parties: the European Pirate Party, Volt Europa, and DiEM25. The European Pirate Party has 14 national parties in EU member states, and had four MEPs in the previous term. Volt Europa is present across Europe and ran in 15 member states; following the election, it increased its representation from two to five MEPs. Finally, DiEM25 does not have MEPs, but saw three of its national parties running under the same name and with a common manifesto.1

Between the weight of national parties, at the national level, and of Heads of State, at the European level via the European Council, strong European political parties have so far failed to become major players on the European political stage. While parliamentary groups sprang to life with the creation of the European Assembly (predecessor to the European Parliament) in the 1950s, European parties emerged just ahead of the first election of the European Parliament by universal suffrage in 1979, and have remained in the shadow of parliamentary groups ever since. It was not until 2003 that European parties were formally defined and provided with public funding.
As a result, following European elections, national authorities focus on the results of national parties, while the European Parliament lists the performance of its own groups, and little mind is paid to the results of European parties.


This limited knowledge of European parties is particularly damaging for European citizens, as these are the political parties we vote for in fine. And it is upon their programme, and not simply that of national parties, that our representatives will vote in Parliament. Without increased understanding of these parties, two European citizens from different countries may vote for the same European party, but for noticeably different national political programmes.
A first step is to increase available information on European parties, which includes their electoral performance in European elections. This is why we are now presenting a unique overview of the 2024 European elections’ results, as seen from the perspective of European parties.
Methodology
In order to obtain these results, we analysed official electoral results from the relevant government websites in each member state, and verified the European party membership of national parties. This allowed us to assign to each national party its European party of affiliation and to sum up their performance. Since many national parties are not official members of a European party (even though they may sit in the same parliamentary group), a notable fraction of the vote does not belong to any European party — these votes are grouped under the “non-affiliated” heading.
Where national political parties run independently of each other, this process of assigning national votes to European parties is rather straightforward.2 In a majority of member states,3 parties running independently is the norm. In others, including Bulgaria, Croatia, the Czech Republic, France, Italy, Poland, or Spain, many parties run as coalitions, making the assignment process far more complex and slightly subjective. While coalitions are significant in only a minority of member states, they remain responsible for a large share of the vote and must therefore be handled carefully.
Link: https://public.tableau.com/views/EP2024byEuropeanparty/Votesfrompartiescoalitions
Where coalition partners all belong to the same European party (or to none at all), the assignment process remains easy, even if unclear: regardless of whether citizens voted to support Party A or Party B, they voted in fine for the same European party, or for none at all. Therefore, the assignment of votes and MEPs to this or that coalition partner does not impact the outcome of our analysis, even if voters’ specific preferences remain unknown.
However, where two or more national parties run together, but belong to different European parties (or where at least one other coalition member is not affiliated to a European party), assigning votes and MEPs to separate European parties becomes more challenging. For instance, in France, Emmanuel Macron’s “Besoin d’Europe” coalition brings together two parties members of ALDE, one party member of the European Democratic Party (EDP), a candidate member of the EDP but whose own party is in a different country and therefore not itself part of the coalition (and, in that country, part of a coalition of nine parties affiliated to three European parties), and finally five parties not members of a European party — including Macron’s own Renaissance party, the largest in the coalition and winner of 6 out of 13 coalition MEPs. Did that make sense?
Assigning MEPs remains somewhat easy, as individual elected officials can often be traced to a single party, but nevertheless involves substantial tracking of each MEP elected on a coalition list. In some unusual cases, the assignment itself is also not evident. In Spain, for instance, the Sumar coalition elected three MEPs, including one from the “Catalunya en Comú” political party. However, Catalunya en Comú is an umbrella of several parties, including Equo, a member of the EGP, and several parties not affiliated to a European party. In this case, the newly-elected MEP was previously a member of a non-affiliated party that joined Catalunya en Comú, so the MEP is not assigned to the EGP. However, Catalunya en Comú was set up in 2017 and this MEP’s own preference may have shifted in the meantime.
Assigning votes in coalitions is by far the most complex aspect, as this requires knowing which individual party citizens meant to vote for when casting their ballot for the coalition list. On the one hand, since a coalition comprises several parties and it is this unique alliance that defines the coalition’s programme, all parties in the coalition can, in some way, be considered supported by voters. On the other, since voters’ preferences are personal, voters need not support parties in line with their respective weight in the coalition. As such, it may well be (theoretically) that all voters actually aimed to support a single party within a coalition. In the absence of preferential voting (and, even then, preferential voting tends to indicate support for individuals, more than for parties), it is impossible to precisely assess the latter scenario.
The former scenario (weighing voter support based on national parties’ weight within the coalition), despite its formal bias, is therefore the only feasible option. But, even then, how do we assess this support? Without an explicit coalition agreement spelling out respective weights for each coalition partner, the closest approximation is probably each national party’s number of candidates on the common list. However, it may also be that smaller parties are given non-eligible positions on the coalition list as token representation, while the bigger parties fare better in eligible positions. Counting all candidates (especially in countries with large contingents) may therefore also not be truly representative of the relative importance of parties.
Our approach was therefore to focus on elected candidates, in order to give more weight to the top positions rather than equal weight to all. However, this is admittedly not a silver bullet, and leaves questions unanswered. In particular, where few candidates are elected (either because the coalition fared poorly, or because the member state has a small national delegation), ratios may easily be skewed one way or another. Even more so, when the coalition receives votes but no MEPs, no information is provided. In these cases, and unless one party is noticeably bigger than its partners, we chose to split votes equally. For instance, the coalition “Stati Uniti d’Europa”, in Italy, features several middle-sized parties and received just under 900,000 votes, but no MEPs; in this case, each of the nine coalition parties received 11% of the vote count. Likewise, still in Italy, while the Südtiroler Volkspartei won the only MEP of its coalition (therefore 100%), we decided to split the votes equally between coalition members.
What we already know
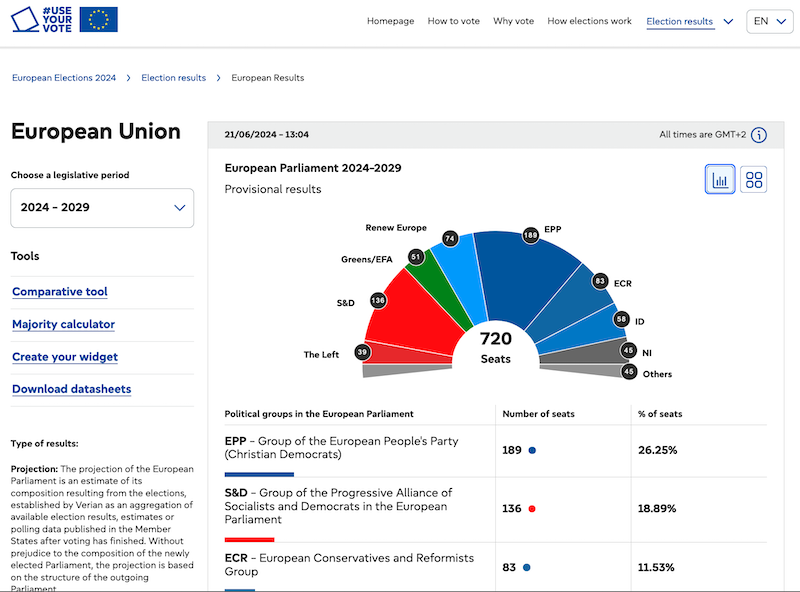
As indicated, one of the most reported counts is that of political groups in the European Parliament, where national parties and MEPs are currently finalising discussions on group membership. These figures provide a broad understanding of the result of the vote at the European level, and are essential to understand the balance of power within the European Parliament. As a result, they naturally provide a solid starting place for our own analysis. As of 24 June, group projections stand as follows.
Link: https://public.tableau.com/views/EP2024byEuropeanparty/EvolutionofEPgroups
Note: these figures are not final and, given the large number of “non-inscrits” (MEPs not part of any group), group composition could change notably.
The evolution of the groups following European elections seems to support the oft-heard “centre holds” theory, with the EPP gaining seats and the PES losing minimally. The rest of the groups see a transfer, with pro-EU liberals and greens losing around 25% of their seats, while the eurosceptic ECR and ID increase by 18 to 20%. Finally, the number of “non-inscrits” bumps by over 35%, while the Left remains virtually unchanged.
One of goals of our analysis is to contrast the figures above, for political groups, with the results of European political parties.
The vote count
Undoubtedly, the first results one looks at following an election is the number of votes received by each party. As mentioned, given the structure of the European political system, this is usually done at the level of national parties. Here, mindful of the shortcomings detailed in our methodology, we look at the results at the level of European political parties for each country, and for the EU as a whole.
Link: https://public.tableau.com/views/EP2024byEuropeanparty/EP2024results
Note: as indicated, following improvements in reporting by national entities and in our methodology our 2024 results are more accurate than those of 2019. Results for 2019 should therefore be considered as informative and not exact figures.
The first notable element is the continued performance of non-affiliated parties (national political parties that are not members of a European political party), which overtake the EPP by around 4 million votes (over 2% of votes cast). This result confirms the limited relevance of European political parties, with close to 1 in 4 voters supporting a non-affiliated party. This is despite a small decrease compared to 2019, with 400,000 fewer votes (-1%); however, an extra 24 million votes had been cast in 2019, and affiliated parties lost more votes, leading to an increase in the vote share of non-affiliated parties (from 21 to 24%).
This importance of non-affiliated parties indicates, a contrario, how much the lines could change for European parties if these national parties could be convinced to join the fray, either in the creation of new European parties or in boosting existing ones. Either way, this shows that the current European party system fails to properly account for the opinion of many European voters.
Unsurprisingly, the EPP and PES place second and third, with the former comfortably outpacing the latter by 8.7 million votes (5% of votes cast). While the PES gets an expected drop in votes compared to 2019 (-17%), the EPP’s own decline (losing over 1.1 million votes) directly contradicts the MEP gains of its political group. However, unlike the PES, whose share of the vote drops by 1 percentage point (from 17.8% to 16.9%), the EPP actually increases its vote from 19.7 to 21.8%.
After this leading pack, come four middle-sized European parties, starting with the Identity and Democracy Party (ID), comfortably outpacing the ECR, the EGP, and ALDE. In terms of European party votes, ID is therefore ahead of the ECR; this is unlike the order of political groups, where the ECR Group also includes MEPs from the European Christian Political Movement (ECPM) and some from the European Free Alliance (EFA).
When compared to 2019, both ID and the ECR increase their vote count, but the latter only gains 400,000 votes (+3%), far behind ID’s whopping 3.4 million increase (over 20%); they also both gain in vote share with an extra percentage point for the ECR and over 3 points for ID. These increases mirror gains for political groups, but not proportionally: ID Group gains 18% in MEPs, while the ECR Group triples its 3% vote increase with a more than 10% MEP increase. Finally, it is worth noting that the combined votes of far-right and nationalist forces (ID, the ECR, and the ECPM) do overtake the PES, but stall behind the conservative EPP.
The EGP and ALDE, in this order, wrap up this middle group. As expected, both parties experience dramatic losses, with -34% for the EGP (-1 point of the vote share) and -50% for ALDE (4 points down). In both cases, these losses are cushioned in political groups, where parties “only” drop around 20 to 25%.
Lagging far behind are the remaining four European political parties and the three non-registered political alliances, all under 2% of votes cast, with different fates. Three out of four European parties experience significant losses: the centrist EDP loses 27%, regionalist EFA close to 50%, and left-wing European Left (EL) almost 54%. Meanwhile, the smallest European party with 0.67% of votes cast, the christian-conservative ECPM increases its vote count by over 44%.
Volt emerges as the real victor among these parties and alliances with close to 1.5 million votes (overtaking the ECPM), providing an impressive 230% increase compared to 2019. DiEM25 also receives a strong increase with +106%, but its meagre 350,000 votes strongly nuance this performance. Finally, the European Pirate Party receives 440,000 votes following a 46% decrease.
The MEP count
Following the election, votes translate to MEPs. However, between member states’ electoral thresholds (more on that below) and the limited number of MEPs in smaller states, the number of MEPs is not directly proportionate to each party’s votes. It is therefore interesting to assess each European party’s number of MEPs, and see how the share of MEPs fares against the vote share.
Note: in the comparisons below, since MEP membership evolves between elections, we contrast the 2024 post-election results with the 2024 pre-election figures, and not with the 2019 post-election results.
Link: https://public.tableau.com/views/EP2024byEuropeanparty/EvolutionofMEPs
Note: MEPs members of European political parties are either members via their national political party (when this party is full member of the European party in question) or as individual members (when the national party is not affiliated to a European party). In the last counts of MEPs before the 2024 elections, there were 63 such individual members. Since the results of the elections only account for the result of national parties and their affiliation to European parties, individual members cannot be factored in. In order to provide comparable figures, we therefore excluded individual members from the count of European parties’ MEPs ahead of the elections; failure to do so would have led to artificial decreases in MEP numbers.
The first striking element is that, despite gaining over 4 million more votes than the EPP, non-affiliated parties come second to the centre-right party by 21 MEPs. The EPP actually wins another 3 MEPs (under 2% of its total contingent), but decreases its share of all MEPs (from 27.5 to 23.9%). Meanwhile, MEPs from non-affiliated parties drop by a notable 20 MEPs (an almost 12% decrease), highlighting that many votes for non-affiliated parties are wasted by legal and natural thresholds, and do not translate to MEPs. As for them, the socialists, despite the loss of 6 million votes, manage to snatch another 16 MEPs, an increase of close to 14% of their contingent.
Similar patterns can be seen in the “middle group”. The outcome of the election certainly has an impact — including ID overtaking ALDE and the EGP following a comfortable 47% increase, and moving from sixth to fourth position — but pro-European parties largely cushion their losses. As such, the EGP loses 7 MEPs (a 14% downturn, compared to 34% for its votes), and ALDE actually increases by 3 MEPs despite losing 44% of its votes.
Among the smaller parties, EL loses almost half of its MEPs, decreasing from 17 to 9 (roughly matching its vote drop), while Volt increases from 2 to 5, a comfortable 150% increase, yet falling short of its vote increase.
The precise evaluations of European parties per member state can be seen in the visualisations below.
Link: https://public.tableau.com/views/EP2024byEuropeanparty/Evolutionperparty
Link: https://public.tableau.com/views/EP2024byEuropeanparty/Evolutionpermemberstate
Finally, we see a broad correlation between shares of votes and shares of MEPs. However, disparities do exist and favour particularly the EPP (+2.1 points for its share of MEPs compared to its vote share), the PES (+1.5 points), and ALDE (+2.2 points). Conversely, they especially disfavour ID (-1.2 points) and, unsurprisingly, non-affiliated MEPs (-3.1 points).
Link: https://public.tableau.com/views/EP2024byEuropeanparty/Votev_MEPshares
European public funding
The final consequence of EP elections for European parties is the determination of European public funding, which is crucial as it regularly accounts for 85 to 90% of their total income. The funding of European political parties is described in Regulation 1141/2014 on the statute and funding of European political parties and European political foundations, amended in 2018 and 2019.
According to Regulation 1141/2014, registered European political parties can apply for public funding from the budget of the European Union. Every year, a total funding envelope is determined by the European Parliament: 10% of it is distributed equally to all registered parties qualifying for funding (parties with at least one elected MEP), and the remaining 90% is distributed in proportion to each party’ number of MEPs. This determines the amount that European parties are entitled to; depending on their actually level of spending, party may eventually receive less, but never more, than this amount. For the year 2024, the total envelope that European parties were entitled to was €50 million.
Assuming the envelope remains constant4 and using our MEP results, we can estimate European parties’ public funding entitlement for the year 2025.
Link: https://public.tableau.com/views/EP2024byEuropeanparty/Publicfunding
The main impression is that of a general stability in the distribution of public funding. Amounts evolve, but there is no major disruption akin to the electoral downturns experienced by ALDE or the EGP. Let us keep in mind, however, that these figures do not account for MEPs joining European parties as “individual members”.
Looking more precisely, we note that despite gaining a few MEPs, the EPP would be set to actually lose European public funding. This is because, unlike for the overall MEP count, non-affiliated MEPs are not included in the distribution of public funding; since the number of non-affiliated MEPs decreased notably, their absence makes the EPP a loser of public funding.
Conversely, the PES, gaining a substantial number of MEPs, would increase its funding from the budget of the European Union, which raises direct issues with the structure of European public funding: not only does the EPP lose money as it wins seats (but loses votes), but the PES gains more funding as it loses even more votes than the EPP (with an almost 17%, compared to the EPP’s under-3% loss).
This situation is the natural result of the structure of European parties’ funding from the EU budget. Firstly, European public funding is not based on direct electoral performance (votes received by European parties), but only on indirect performance (MEPs affiliated to European parties). This means that parties losing votes but gaining seats are susceptible to increasing their amount of public funding. Secondly, public funding is not calculated based on European parties’ number of MEPs, but on their share. This would not be an issue if all MEPs were recorded, but, with non-affiliated MEPs discarded from the count, a party only needs to lose fewer MEPs than some competitors to increase its share and, therefore, its funding. European Democracy Consulting has long advocated for a reform of European public funding, including by relying on votes instead of MEPs to more adequately assess electoral performance.
The distribution of public funding is less problematic for other parties, as it is more in line with their evolution of MEPs, even though the major vote losses experienced by the EGP and ALDE once again do not translate to critical losses in public funding. For instance, while ALDE lost almost 50% of its votes, it is only set to lose around 1% of its public funding.
Finally, political alliances included in this analysis (Volt, the European Pirate Party, and DiEM25) cannot receive public funding from the budget of the European Union, as they are not registered European political parties. Nevertheless, we also simulated the distribution of public funding if these alliances had managed to register, and differences are minimal. At any rate, DiEM25, which did not manage to elect an MEP, would remain ineligible for public funding (even to the equally-distributed lump sum). In practice, the EU’s restrictive criteria for registration as a European party remain a strong obstacle for a level-playing field extending to the EU’s smallest alliances, even for Volt despite receiving 20% more votes and 25% more MEPs than the ECPM.
Other post-electoral considerations
In addition to votes, MEPs and public funding, the results of the 2024 European elections also provide insight on turnout, and invalid and ignored votes. While not related to European parties, these side considerations remain useful in the general assessment of the design of European elections.
Voter turnout
Voter turnout is not a new information per se, as it was made available alongside national results, but, as we do in our geographical representation of EU leadership positions, it is enlightening to bring a geographical perspective to this metric.
Link: https://public.tableau.com/views/EP2024byEuropeanparty/Turnoutbyregion
Link: https://public.tableau.com/views/EP2024byEuropeanparty/Turnoutbymemberstate
Overall, a worrying 16 out of 27 member states experienced a turnout below 50%. But, from a geographical perspective, these states are not distributed randomly. From Belgium (89%) down to the Netherlands (46%), Western Europe places first, with close to a 60% turnout, and its seven member states feature roughly in the first half of states ordered by turnout.
Southern Europe, which had placed second in 2019, drops to third place and see major discrepancies, from a 73% turnout in Malta down to less than 37% in Portugal.
As in 2019, Central and Eastern Europe lag behind, but with different situations. Central Europe sees an impressive 9-point increase, driven by a 16-point bump in Hungary; however, it retains the lowest regional turnout (41%) and also floors the member state ranking with Croatia at a meagre 21%. Meanwhile, Eastern Europe decreases by 3 percentage points (43%); its highest voting member state, Romania, barely reaches 52%, and 5 of its 6 member states feature among the ten least-voting states.
Out of interest, we decided to have a look at an alternative apportionment of EP seats factoring in member states’ turnout. Currently, degressive proportionality assigns each member state with a number of MEPs based on its demography, with delegations ranging from 6 to 96 MEPs. From this apportionment, we obtain a number of citizens-per-MEP for each member state.
In our apportionment, member states obtain their full number of MEPs if they reach a 90% turnout rate. National delegation sizes are then calculated based on member states’ turnout, meaning the citizens-per-MEP number becomes a number of voting-citizens-per-MEP. For instance, Germany would receive its 96 seats with a 90% turnout; given its 65% turnout, it receives 69 MEPs. Meanwhile, with close to 89.8% turnout, Belgium does receive its entire 22-seat contingent. This system would directly reward member states and citizens who turn out to vote with a better representation.
While unlikely to ever see the light of day, this scenario would surely entice member states and political parties to strengthen the national turnout, even perhaps adopting compulsory voting as in Belgium and Luxembourg.5
Link: https://public.tableau.com/views/EP2024byEuropeanparty/Variableseats
Thresholds and votes ignored
In order to lead to the election of candidates, votes must pass two types of thresholds: natural thresholds and legal thresholds.
Natural thresholds are unavoidable mathematical barriers linked to the number of seats in a constituency in relation to the number of votes. They are calculated as follows: [total number of votes cast / (number of seats + 1)] + ε, where ε is the smallest possible number of votes. For instance, in a member state with 9 seats, its take around 10% of the votes cast to elect an MEP. Natural thresholds may also vary based on other factors, including the apportionment method.
By contrast, legal thresholds are legally-defined shares of the votes cast needed to qualify for representation. Being defined by law, these thresholds are, by nature, avoidable. For European elections, legal thresholds range from 0% (no threshold) to 5%.
Therefore, while candidates failing to win a seat due to natural thresholds simply means that they or their party have not garnered sufficient electoral support, candidates failing to meet legal thresholds means that votes cast in their favour were downright ignored from the seat distribution process.
The visualisation below shows the number and share of votes ignored as a result of legal thresholds in member states.
Link: https://public.tableau.com/views/EP2024byEuropeanparty/Votesignored
The votes shown above are the sum total of all votes cast in favour of candidates and parties that failed to meet legal thresholds in their member state.
The first observation is that some votes are ignored in over half of EU member states. This is a direct consequence from the fact that 14 out of 27 member states have legal thresholds in place. While not new, this observation highlights a major inequality between European citizens heading to the polls. In under half of the member states, citizens have a fair chance to elect candidates from smaller parties (even though natural thresholds come into play); in over half, however, candidates from smaller parties face a legal barrier encouraging voters to support larger parties, for fear that their vote will not count.
In this self-fulfilling prophecy scenario, voters may refrain from supporting smaller parties out of fear that these parties will not meet the legal threshold and, in doing so, actively contribute to these parties not meeting the threshold. While there are arguments in favour of legal thresholds, not only do they constitute a barrier to electoral pluralism, but, in the case of European elections, the absence of a harmonised threshold discriminates against voters in certain member states.
The second observation is that the number of votes ignored is substantial: out of the 180 million votes cast in the 2024 European elections, close to 10 million were discarded, or 5.4% of all votes cast. To put this in perspective, this is more votes than there are citizens in Hungary or Austria, more votes than there are registered voters in Greece, and more votes than people actually voted in Romania — the EU’s sixth most populous member state.
Finally, beyond the absence of legal thresholds in 13 member states, there are major inequalities in the distribution of these ignored votes. As expected from large member states with relatively high thresholds, France and Italy stand out with close to 3 million discarded votes each. Romania comes a distant third, with another 1.4 million votes, before another eight member states with figures ranging between 100,000 and 500,000.
In terms of share, there are at least four member states where discarded votes rise above 10% of valid votes cast: Slovakia, Romania, Greece, and France — with Slovakia reaching over 20%. Note that not all member states are displayed in the “share” view, as we focus on the share of valid votes (total votes cast minus invalid votes), and many member states (including Italy and Hungary) do not provide the number of invalid votes, instead merging invalid votes with blank votes (more on this below).
Invalid votes
Separately from ignored votes is the issue of invalid votes — votes cast in favour of a candidate or party that, as a result of the way they are filled, are not included in the vote count. Votes may be invalid for a number of reasons, from being wrongly filled in (for instance indicating more names or preferences than is allowed), to being unclear, containing personal information, having a physical defect, or, depending on the legislation, being blank.
This last case makes the count of invalid votes difficult, as many member states consider blank ballots to be invalid and, as a result, do not distinguish blank ballots from other invalid ballots in their official reporting. From a democratic perspective, this is unfortunate, as casting a blank ballot often specifically aims at signifying a rejection of all candidates; this may also be the case for other invalid votes (such as ballot filled with insults), but less systematically.
By contrast, certain member states separate the count of invalid votes from blank ballots, allowing a more precise view of the number of ballots that were specifically “invalid and not blank”. For its part, Bulgaria even includes on the ballot a “I do not support anyone” option that allows to specifically count ballots cast for no party or candidate.
Because of the limitations and lack of harmonisation in electoral reporting, we are only able to show the number of invalid votes for 13 member states.
Link: https://public.tableau.com/views/EP2024byEuropeanparty/Invalidvotes
Overall, across the 13 member states for which information is available, invalid votes only make up 1.6% of all votes cast. However, these 1.3 million votes remain more numerous than the entire populations of Malta, Luxembourg or Cyprus, more than Estonia’s registered voters, and almost as many as the entirety of voters in Slovakia. They are also more numerous than the entire vote count of three parties and alliances observed in this analysis. As such, they clearly deserve some amount of attention.
In particular, a few member states clearly stick out. First of all, with over 370,000 and 484,000 invalid votes respectively, France and Romania alone account for over 67% of the counted invalid votes. Romania alone has more invalid votes than people voted in four member states.
Of course, these two countries have large populations, meaning there is bound to be more invalid ballots, but Romania also tops the ranking for invalid ballots as a share of votes cast, with 5.2% of votes cast being invalid. Luxembourg comes second with 4.5% of invalid votes, and another six member states have rates being 1 and 3%.
Since invalid votes are often unwanted by voters, these figures must be contrasted with those of Sweden, Slovakia, or the Netherlands, where rates fall between 0.2 and 0.1% of all votes cast. While there may be differences in the way invalid votes are assessed, these major discrepancies are sufficient to give national authorities pause, and to suggest a need to review ballot designs and voting processes in order to bring down the number of invalid votes.
A more thorough analysis of invalid votes falls outside the scope of this review, but our results once again underline the need for more harmonisation and exchanges of best practices across the EU in order to ensure that as many votes as possible are properly accounted for, starting with a clear distinction between invalid and blank ballots.
For a party-centric view of European politics
At the time of writing, the above data is unique — and, to our knowledge, our similar analysis for the 2019 elections remains unique to this day. European political parties are such second-class political stakeholders that no one seems to have taken the time to go through official records to see what these elections meant from their perspective.
From the dimensions we observed, we found noteworthy conclusions. First of all, we saw that the PES, despite losing votes, actually increased its number of MEPs. This shows that, despite being made up of proportional elections, the EU’s electoral system, strictly split between 27 member states, does not, in fact, ensure an overall proportional outcome. This should lead us to consider reforming the EU’s electoral law, in particular by introducing an EU-wide party vote, preferably alongside local constituencies much closer to citizens than many current member state-wide constituencies. A mere few seats elected on transnational lists would not remedy this issue.
We have also seen the very high weight of national parties that are not affiliated to any European political party, with these parties’ vote count overtaking all European parties. This is damaging to the clarity of their position, as voters are less likely to know what political agenda they will support once in Parliament and who they will sit with. This should lead us to consider reforming the Regulation on European political parties, for instance by reforming the funding of European parties to reward membership, as well as the EU electoral law, for instance by requiring, at the very least, the display of European parties’ logos on ballots alongside those of national parties (which is currently simply allowed, but in practice forbidden in several member states).
We have seen that the public funding of European parties does not truly reflect their showing at the polls. Meanwhile, given the high bar for registration as a European party — and, therefore, to qualify for public funding —, smaller parties or newcomers often remain unregistered and must continue to operate without European public funding, despite positive electoral performances and being sometimes more integrated across borders than registered European parties. There are several components to public funding schemes, but directly rewarding electoral performance should be one of them, and the current EU public funding scheme is failing in this regard. This should lead us to consider reforming the EU’s provisions on the registration and funding of European parties.
Finally, we have seen that voter turnout remains dramatically low, especially in Central and Eastern Europe, that legal thresholds meant that the ballots of close to 10 million voters were discarded, and that far too many ballots were considered invalid. For all these reasons, as well as to ensure citizens’ equality before the vote and strengthen similar analyses in the future, our disparate nation-wide elections should be more closely integrated and managed by a European electoral commission and electoral results should be consolidated in an EU-wide register.
From these reforms — of the EU’s electoral law and of the Regulation on European parties, including their registration and funding — we can bring forth a more democratic Union. In order to achieve this, however, it is high time to shift the focus of European politics and elections away from national parties and parliamentary groups, and finally centre the European political system on what ought to be its real core: European political parties.
- In 2019, we included other political alliances. However, these alliances have not been active or were considered not sufficiently visible; this last criteria applies to many other small and loose alliances.
- Slight complications arise when the member parties listed on the website of a European political party do not match the official list published by the APPF.
- Including Austria, Belgium, Cyprus, Denmark, Estonia, Finland, Germany, Greece, Hungary, Ireland, Latvia, Lithuania, Luxembourg, Malta, the Netherlands, Slovenia, and Sweden
- The envelope of public funding increased from €46 to €50 million for the year 2024; however, it had previously remained unchanged for three years. Continued high inflation makes potential future increases harder to predict. ADDENDUM: on 24 June, the envelope of European public funding for 2025 was confirmed to remain at €46 million in the European Parliament’s call for contributions, which details the modalities to apply for public funding.
- Compulsory voting also formally exists in Greece, but it is no longer implemented.